Registered study · pilot
Do Lighthouse's promised savings materialize?
Lighthouse and PageSpeed Insights don't just flag problems — for many they print a number: “Est savings: 1,200 ms.” Those numbers drive sprint priorities, agency reports and automated optimizers. Yet nobody has systematically checked whether they come true. We built the method, ran a controlled pilot, and publish the full protocol to measure it at web scale.
What we measured
The question is one of calibration: when you implement a recommendation exactly,
does the predicted saving P equal the observed saving R? To get a first signal we
built a controlled harness. For each engineered, single-audit page we read Lighthouse 13's predicted
metric saving (the insight's metricSavings map), applied the exact fix, and took
R as the difference between the median FCP/LCP of five baseline runs and five fixed runs,
interleaved.
Read this before the numbers: what R is
The pilot ran Lighthouse on its default mobile profile, which uses simulated throttling. In that mode Lighthouse loads the page unthrottled and then uses the Lantern model to estimate what FCP and LCP would have been under Slow 4G — the docs are explicit that “the trace values will not match up with Lighthouse's metric results, as the original trace is prior to the simulation.” So R is a change in Lighthouse's own simulated output, and P comes out of the same simulator. The page really was rebuilt between conditions, so the dependency graph fed to Lantern genuinely changed — this is not circular — but it is an internal-consistency test, not an independent stopwatch. What the pilot shows is that Lighthouse's advertised saving is not larger than the move in its own metric when you actually do the fix. Whether those milliseconds appear on a real device, in PSI production, or in field data is not established here, and the registered study below is where that gets tested.
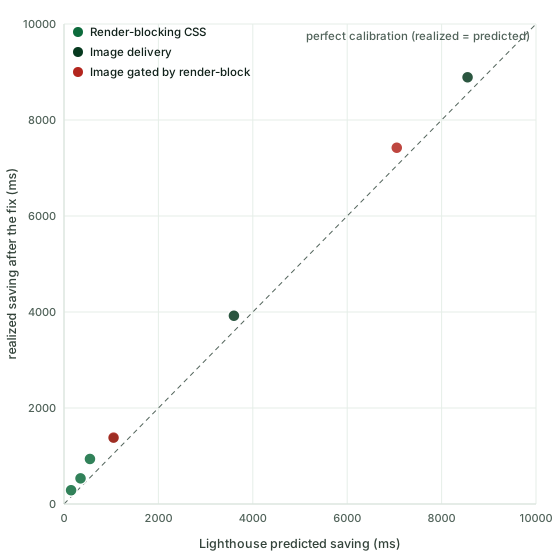
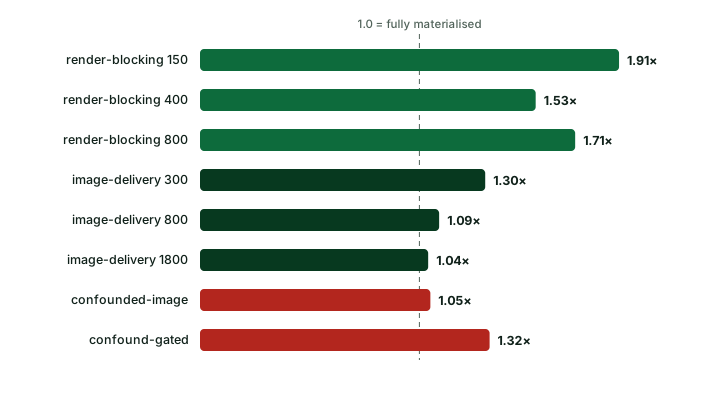
Two honest surprises. First, the common cynicism — “Lighthouse over-promises” — did not reproduce on clean pages, at least inside its own simulator. If anything, render-blocking predictions under-promised: a fix Lighthouse valued at 150 ms moved its simulated FCP by 287. Image-delivery was the most accurate, and tightened toward 1.0 as the image got heavier (1.30× at 300 KB → 1.04× at 1.8 MB). Second, we tried twice to construct the classic over-prediction trap — a heavy image whose paint should be gated by a render-blocking stylesheet — and both times the prediction still materialized, because the image stayed on the critical path. Reproducing over-prediction needs the messy real web, not a synthetic page. Which is precisely the point of the study below.
Why this needs measuring at all
A forecast can be useful even when imperfect — but only if its error is known. Weather forecasts, credit models and medical risk scores are all judged by calibration. Lighthouse's savings number is a forecast too, and as far as we can find, no published study compares predicted savings against realized improvement after an exact fix. The pieces that look like validation aren't:
- Lantern validates the wrong thing. Lighthouse's Lantern accuracy doc reports Spearman's ρ and MAPE for FCP/FMP/TTI on 300 URLs, comparing the median of nine runs in one environment to nine in another. That tests whether simulated metrics resemble lab metrics — not whether fixing a flagged opportunity yields the predicted delta. Those are different inferential problems.
- Lighthouse 13 changed the surface, not the validation. In 2025 Google replaced legacy performance audits with “insights”; Lighthouse 13 made the switch permanent (the score is metric-based, so it's unchanged). The release notes document the migration — they don't publish a per-insight calibration study.
- The maintainers themselves flag the failure modes. A 2019 issue (#8740) modeled image-optimization impact while admitting load-time gains can “fall to zero if JS rendering takes ages.” A 2022 issue (#14107) shows a user summing five savings and asking which metric the total maps to — a common, and usually invalid, move.
- Recent automated-fix work measures something else. The MSR 2026 study on LLM DOM-level performance fixes reports reductions in audit incidence, not whether the predicted milliseconds appeared. An audit can vanish without the saving arriving; a metric can improve while the audit stays flagged.
So the gap is real and specific: the savings number is decision-grade only if we know its error, by audit type. The pilot says “on clean pages, decent and conservative.” The study below says how to learn whether that survives contact with real sites.
The estimand
For each page i, audit a and metric m, Lighthouse reports a predicted saving
P. After implementing exactly that fix, the observed saving is the difference between the
two condition medians over nine runs each:
R = median(metric, baseline) − median(metric, intervention)
calibration error   E = R − P          (negative ⇒ over-prediction)
delivery ratio      Q = R / P          (1.0 ⇒ the metric moved by exactly the promise)
Note what that R is and isn't. It is a difference of two condition medians under randomized
alternation — not a paired statistic. A paired estimator works on the within-pair differences,
median(Bj − Ij), and the two are not the same quantity: for
B = [0, 100, 101] against I = [1, 2, 102] the difference of medians is +98 while the median paired
difference is −1. Interleaving baseline and intervention runs is a real control on host drift, and the
pilot used it; it does not make the estimator paired. The registered protocol below reports both, so
the pairing the design creates is actually used.
A forecast can fail in distinct, useful-to-separate ways. It can be magnitude-miscalibrated (a 900 ms prediction that yields 100 ms), yet still rank opportunities correctly (the biggest predicted fix is the biggest real one) — in which case it's fine for triage but not forecasting. And savings are usually non-additive: five fixes rarely sum, because they compete for the same critical path. The study estimates calibration and ranking utility per audit, not as one global number, because a single slope would hide exactly the differences a practitioner needs — and estimates non-additivity only on the subset of pages that get the factorial arm described below, because a one-audit-at-a-time design cannot identify an interaction at all.
The full study (registered protocol)
The pilot proves the harness works. To answer the question for the web as practitioners meet it, the registered design scales it to real pages and adds a field arm. It is written to be executed, audited and extended — the companion workbook ships the full data schema with result fields left deliberately blank.
Sample 100–200 real pages
Stratified across rank, page type, framework, resource profile and baseline speed, from the public HTTP Archive / CrUX frame — calibration should hold for the messy web, not just clean lab pages.
One audit at a time, by a fixed grammar
“Implement exactly what Lighthouse says” is ambiguous, so each fix follows a pre-registered, minimal patch grammar applied at the HTTP boundary via a proxy. A resolution gate requires the post-fix report to clear the audit (or cut its predicted saving ≥ 90%); a semantic gate (visual diff, DOM and console checks) guards against fixing the number while breaking the page.
Median-of-nine, reported two ways
Nine baseline and nine intervention runs, alternated in randomized blocks, on a pinned single-tenant runner — because Lighthouse's own variability guidance and Lantern validation both rely on medians, not single before/after runs. Both estimators are reported: the difference of condition medians (comparable to the pilot) and the median of the within-block paired differences, which is the one the blocking actually earns.
A factorial arm, or no non-additivity claim
One-audit-at-a-time yields the no-fix, A-only and B-only conditions — and those three can never identify an interaction, because the combined condition is missing:
RAB − RA − RBneedsYAB. Two worlds with identical one-at-a-time results (Y₀ 100, YA 90, YB 90) can hide a perfectly additive YAB = 80 or a strongly antagonistic 95. So commonly co-occurring pairs get a 2×2 sub-study — none/A/B/A+B — starting with render-blocking × LCP-discovery, image-delivery × LCP-discovery, and document-latency × render-blocking. Non-additivity is an estimand only for pages that get the combined arm.Audit-level calibration cards
Per insight: median predicted vs realized, signed error, materialization rate, SMAPE, the calibration slope, ranking correlation and the non-resolution rate — so teams can see that, say, image-delivery is decision-grade while another family is only directional.
A field arm for ecological validity
Join monthly HTTP Archive Lighthouse transitions to CrUX deltas (the History API offers up to 40 overlapping 28-day windows): when an audit flag disappears in the wild, do real-user metrics improve versus matched controls? Observational and secondary — it can't replace the controlled estimand, but it tests whether the lab result has a real-world correlate.
The fixes are deterministic by audit family. A sample of the grammar:
| Audit / insight family | Minimal fix | Primary metric |
|---|---|---|
| Render-blocking | Inline critical CSS / defer non-critical stylesheets and eligible scripts | FCP, LCP |
| Image delivery | Re-encode/resize flagged images to recommended bytes; preserve rendered dimensions | LCP, bytes |
| LCP discovery | Remove lazy-load from the LCP image; add preload / fetchpriority=high | LCP |
| Document request latency | Serve flagged text with gzip/br; collapse redirect chains; fix TTFB at a controlled edge | FCP, LCP |
| Network dependency tree | Add preconnect/preload only for named origins — no speculative preloading | FCP, LCP |
| Legacy / duplicated JavaScript | Serve the modern/de-duplicated bundle when a functionality gate passes | TBT |
Method — the pilot
- Lighthouse 13.4.0, default mobile profile (simulated Slow 4G, 4× CPU), Chrome for Testing 148, headless. This is the same throttling method PageSpeed Insights uses — simulated, via Lantern — but not the same CPU setting: Lighthouse's own PSI/Lightrider config pins
cpuSlowdownMultiplier: 1.2, “determined using PSI CPU benchmark median”, because PSI's production hosts are already slow relative to a developer machine. A local 4× and a PSI 1.2× target a broadly similar mobile class but are not interchangeable, and neither is comparable across hosts without the run'sbenchmarkIndex. The pilot did not record it; the registered protocol does. - Predicted saving from the insight's
metricSavings. Lighthouse 13 surfaces predicted savings as a per-metric map (e.g.render-blocking-insight → {FCP: 250, LCP: 250}), replacing the legacyoverallSavingsMsopportunity field. We read the target metric for the case's audit. - Single-audit synthetic pages. A local server emits a baseline (problem present) and a fixed variant that changes essentially one thing — a render-blocking stylesheet vs the same CSS inlined; an oversized hero PNG vs a right-sized one at the same display box. Byte-exact, incompressible payloads (the kilobyte-study harness),
Cache-Control: no-store. - Median-of-five per condition, interleaved baseline/fixed to spread host-load drift, with R = median FCP/LCP(baseline) − median(fixed). That is a difference of medians, not a paired statistic — the interleaving is a design control, and the pilot's estimator does not use the pair identities. Two families × three severities, plus two render-block-gated image cases — eight cases total.
- One predictor run.
metricSavingswas read from the first baseline report, so P is a single-run value while R is a five-run median. Lantern's predictions vary run to run like its metrics do, so each ratio carries that extra noise. The registered protocol takes the median prediction across baseline runs. - Rounding. R is computed from the unrounded medians and rounded once for publication;
baseline_msandfixed_msare each rounded independently. So one row (image-delivery@300) shows 2270 − 906 = 1364 against a published 1365 — the published R is the correct one, and the CSV's displayed columns are not sufficient to re-derive it. - Scope. This is a proof-of-concept on controlled pages, not the 100–200-site census. The full protocol prescribes median-of-nine and real pages; the pilot's job is to prove the method and produce a first, honest signal.
Limitations — read before quoting
The predictor and the outcome share a simulator
Both P and R are Lantern products: Lighthouse's default mode estimates FCP and LCP from an unthrottled load rather than timing a throttled one. The intervention genuinely changed the page, so this is a real test of whether the promise survives doing the work — but it is Lighthouse checking its own arithmetic. An independent outcome needs applied (not simulated) throttling with external traffic shaping, WebPageTest or equivalent, target hardware, or field data. Read the pilot as internal consistency, and do not quote it as evidence that the milliseconds reach users.
Clean pages, not the real web
The pilot's whole limitation is its cleanliness. Synthetic single-audit pages isolate the effect perfectly — which is exactly why predictions look well-calibrated. Real pages have JS that gates paint, third parties, A/B tests and field-vs-lab gaps that the full study exists to capture.
The over-prediction case is unproven
We could not synthesize a confound where Lighthouse over-predicts; the optimized resource stayed on the critical path. So the pilot shows predictions can be conservative, not that they never over-promise. Don't read it as “Lighthouse is always right.”
Small N, two families
Eight cases across render-blocking and image-delivery. The calibration map needs many audit families at n ≥ 30 each — descriptive only below that.
Pilot used median-of-five
To keep runtimes bounded; the registered protocol prescribes median-of-nine.
Run-level records were not kept
Eight cases × five runs × two conditions is eighty observations, and the harness that produced this pilot wrote only the per-case medians — the individual run values were never persisted, so the published CSV cannot contain them and nobody, including us, can recompute a median, inspect an outlier, or form the paired differences. The harness now emits a run-level record per run; a future execution will publish it. Until then, treat the eight rows as aggregates you must take on trust, which is exactly the standard this study exists to raise.
One pinned version
Lighthouse 13.4.0. Predictions change across versions; the calibration card is versioned and meant to be re-run at major releases.
Data, protocol & sources
The pilot dataset and the full study workbook (data model, dictionary, calibration formulas and SQL templates, with empirical fields blank) are published under CC BY 4.0 — run the harness, disagree with the design, or execute the full study and publish the cards. The pilot CSV holds eight per-case aggregate rows — one per case, not one per run — for the reason given in the limitations.
Key sources
- Google Chrome (n.d.). Lighthouse performance scoring & Lighthouse variability.
- GoogleChrome/lighthouse. Lantern model validation (300 URLs, median-of-nine, FCP/FMP/TTI).
- Google Chrome Developers (2025). Lighthouse is moving to performance insight audits & What's new in Lighthouse 13.
- Google. PageSpeed Insights API.
- GoogleChrome/lighthouse issues #8740, #14107, #16769 and discussion #16462.
- HTTP Archive (2025). Web Almanac methodology. Chrome UX Report. CrUX on BigQuery & History API.
- Peters, G., Khatoonabadi, S.H. & Shihab, E. (2026). Evaluating the Use of LLMs for Automated DOM-Level Resolution of Web Performance Issues. arXiv:2601.05502 (MSR 2026).
Cite this study
PageSpeedAudit Research (2026). Do Lighthouse's promised savings materialize?
A registered calibration study of PageSpeed Insights and Lighthouse predicted
metric savings. https://pagespeedaudit.com/research/do-lighthouse-savings-materialize

@misc{pagespeedaudit2026lighthousecalibration,
  title  = {Do Lighthouse's promised savings materialize? A registered
            calibration study of Lighthouse predicted metric savings},
  author = {{PageSpeedAudit Research}},
  year   = {2026},
  url    = {https://pagespeedaudit.com/research/do-lighthouse-savings-materialize},
  note   = {Pilot dataset + protocol workbook, CC BY 4.0}
}
Want to know which of your savings are real?
A PageSpeedAudit report doesn't just forward Lighthouse's numbers — it reads your real critical path and tells you which fixes will actually move LCP and INP, and by how much. Our sister study “The cost of a kilobyte” measures what a fix is worth per resource type, and the free cloaking test checks whether a “95+” score is even real.