Original research
The cost of a kilobyte
“It's only 100 KB” is how pages get slow. We measured what those bytes actually cost — 210 controlled Lighthouse runs on synthetic pages that change exactly one thing at a time. The headline surprised us: on the wire, every critical-path kilobyte costs the same. The real money is elsewhere.
The price list
Each slope below is a least-squares fit through the median of 7 runs per size step, on Lighthouse's default mobile profile (simulated Slow 4G: 1.6 Mbps, 150 ms RTT, 4× CPU throttling — the same lab profile PageSpeed Insights uses):
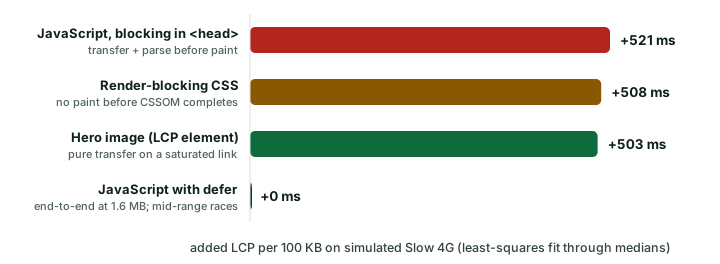
Three findings carry the article. On the wire, bytes are bytes: blocking JavaScript
(521 ms/100 KB), render-blocking CSS (508) and hero images (503) are priced within 4% of each
other, all near the connection's theoretical 500 ms/100 KB floor — the folk wisdom that a
JavaScript byte costs several times an image byte is about execution, not transfer.
What you actually pay extra for is execution (+5.2 s at identical size),
placement (the defer race below), and discovery (149 ms per chain hop).
And the lab has blind spots it pays to know about: Lighthouse's simulation billed
deferred mid-size bundles to LCP anyway, and could not tell font-display: block
from swap at all.
Why measure this at all?
The industry has excellent correlational data — the HTTP Archive Web Almanac tracks what the web ships, and the Chrome UX Report tracks what users experience. But correlations across millions of wildly different sites can't tell you what one more kilobyte costs your page, because heavy pages differ from light pages in a hundred ways at once.
What's missing is the boring middle: a controlled experiment that holds everything constant and moves one variable. That's what we ran. Prior art in this spirit — “The cost of JavaScript” (V8, 2019) — measured parse/compile cost of real bundles on real devices; we complement it with a clean dose-response curve per resource type, on the exact lab profile your Lighthouse score is computed from.
One number to keep in mind throughout: on this profile the bandwidth ceiling is 1.6 Mbps = 200 KB/s, so the theoretical floor for 100 KB is 500 ms of pure transfer. Our measured slopes land 1–4% above that floor — the experiment recovers the physics, which is the best sanity check a lab harness can pass. (Our budget calculator models exactly that floor, including TCP slow start and per-request round trips.)
JavaScript: placement beats size — with a twist
We served a page whose only variable is one script — its transfer size (100 KB to 1.6 MB of
high-entropy, effectively incompressible code, fully parsed but executing only a stub), and whether it
loads as a classic blocking <script> in the <head> or with
defer.
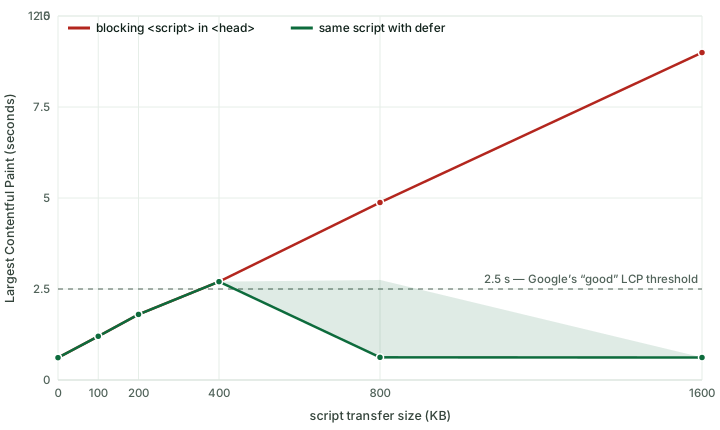
The blocking series behaves exactly as budgeting folklore says: 521 ms of LCP per 100 KB (R² = 0.9997), crossing Google's 2.5 s “good” threshold at roughly 350 KB — on a page that does nothing else, served with zero TTFB. Notably, that is only ~4% above the pure-transfer price of the same bytes as an image: under Lighthouse's 4× CPU throttle, parsing 100 KB of dense JavaScript added just ~18 ms. Modern engines parse lazily and cheaply; transfer dominates until code runs.
The defer race
First the part that worked: with defer, FCP stayed at 0.61–0.62 s at every
size — even 1.6 MB. The download left the parser's critical path, exactly as advertised.
End to end, deferred LCP at 1.6 MB was 4 ms above baseline: effectively free.
But the mid-range is strange, and the strangeness is instructive: at 100–400 KB the deferred script's simulated LCP matched the blocking series to the millisecond (2,702 ms vs 2,702 ms at 400 KB), at 800 KB the seven repeats split bimodally (five runs ≈ 0.62 s, two runs ≈ 4.88 s), and at 1.6 MB every run was back at baseline. The mechanism: a deferred script still executes before first paint if it finishes downloading before the browser's first rendering opportunity. In the underlying unthrottled trace our small bundles always won that race against the renderer, the 800 KB bundle sometimes won, and the 1.6 MB bundle always lost — and when script execution precedes the observed paint, Lighthouse's Lantern simulation bills the whole simulated download to your LCP.
Two takeaways. For your metrics: lab LCP can punish a deferred bundle that field LCP wouldn't — on a real Slow-4G connection the 400 KB download takes ~2 s and the paint wins easily; this is a lab-vs-field gap, not a defer bug. For your sense of humor: Lighthouse scored our 400 KB deferred bundle 96 and our 800 KB one 100. When a single lab number disagrees with itself like that, trust the trend, not the integer.
Execution: the cost that isn't in the bytes
We then held the script constant at 200 KB — blocking, in the head — and dialed up only the work it performs before returning. Transfer size identical, completely different page:
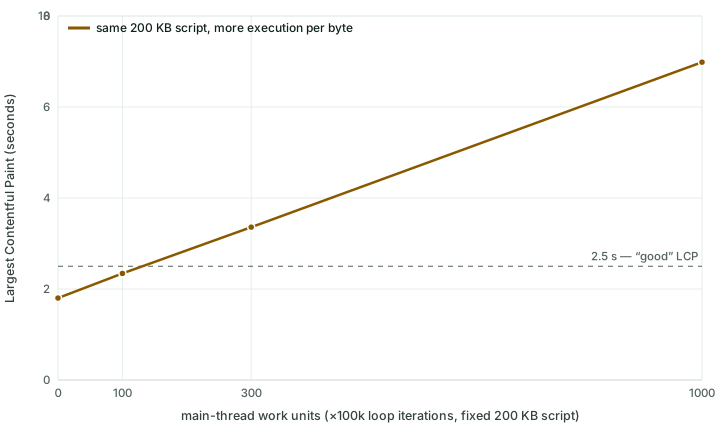
LCP goes from 1.8 s to 7.0 s without a single extra kilobyte on the wire — the heaviest work setting (~1.3 s of real execution, ≈5.2 s under the 4× mobile throttle) cost more LCP than adding 1,000 KB of script. Worse for your dashboards: Total Blocking Time stayed at 0 ms throughout, because the work ran before first paint and TBT only counts long tasks after it. Byte budgets miss execution by design; here even the execution metric missed it. Two bundles of identical size can sit on opposite ends of the user experience — which is why a budget is the start of performance work, not the end.
Images and CSS: the critical path charges by the byte
The hero-image series replaces the script with a single above-the-fold <img>
(the LCP element), from 100 KB to 4 MB. Decode cost is held constant — every variant is
the same 1200×600 pixel grid; only embedded incompressible metadata varies the transfer size.
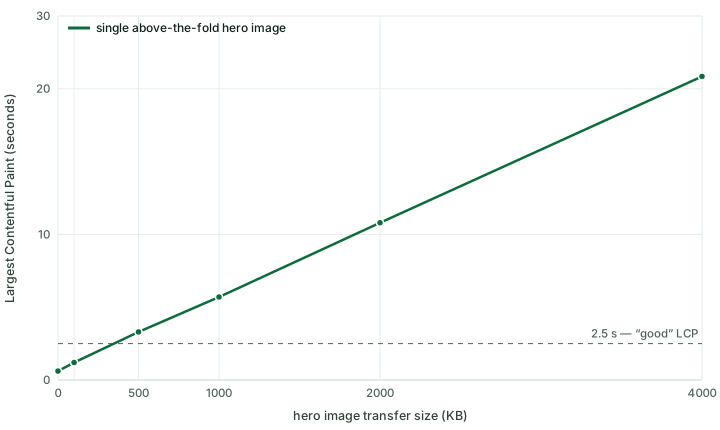
This is the cleanest line in the study: 503 ms per 100 KB, R² = 1.0000, within 0.7% of the 500 ms/100 KB bandwidth floor. Once TCP slow start has opened the window, every 100 KB you cut from your hero image buys back almost exactly half a second of mobile LCP — the most reliable exchange rate in web performance. A 4 MB hero (LCP 20.9 s) is twenty seconds of arithmetic, no mystery involved.
Worth a raised eyebrow: that 4 MB-image page still scored 75, while 1.6 MB of blocking JavaScript — with an LCP less than half as bad (9.0 s) — scored 57. The score blends FCP, Speed Index, TBT and CLS alongside LCP, and the image page keeps all of those pristine. The score is a useful compass and a poor ruler; the metrics are the ruler.
Render-blocking CSS prices identically per byte — 508 ms per 100 KB — but against first paint: the browser will not render before the CSSOM is complete.
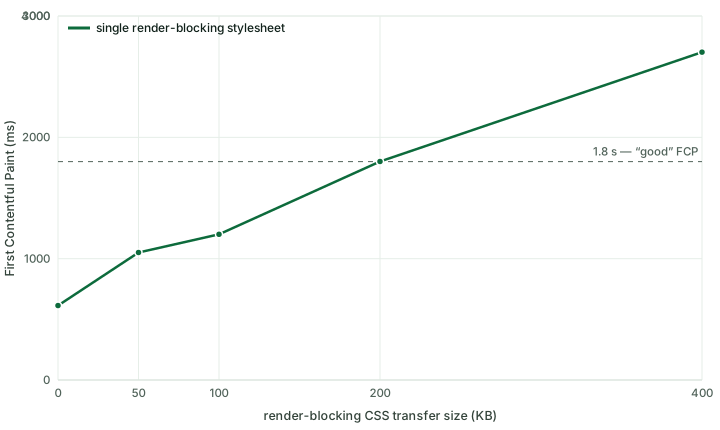
The mitigation is different, though: you can rarely defer CSS wholesale, but you can keep the blocking part small — critical CSS inlined or served lean, the rest loaded asynchronously. (This page's entire stylesheet is ~14 KB compressed; at the measured rate that's ~70 ms. We walk the talk.)
Fonts and request chains: where milliseconds actually hide
Webfonts — the same 22 KB variable WOFF2 this site uses, declared via inline
@font-face — turned out to be cheap and to expose a lab blind spot:
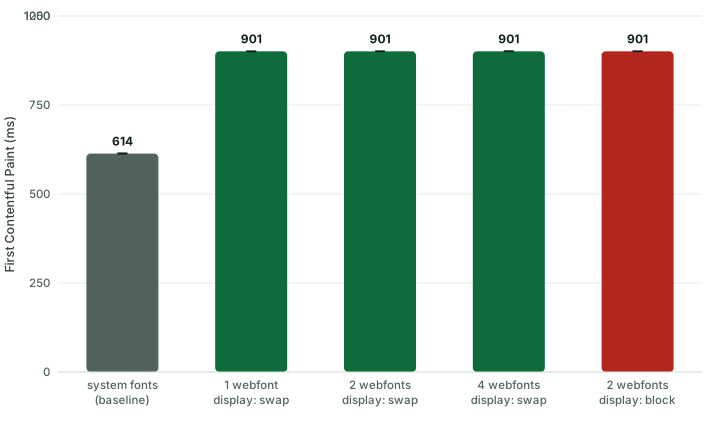
block is indistinguishable from swap, which is the finding.
Adding webfonts cost a flat +287 ms of FCP, once — one, two and four fonts all
landed on the same value, because the fetches parallelize. The eyebrow-raiser is the last bar:
font-display: block measured identically to swap, to the
millisecond. In reality, block hides your text while fonts load and swap
doesn't — a difference any user on a slow connection can see, and
field data reflects. The
simulated lab cannot see it: fonts arrive in ~1 ms from a local server in the underlying trace, so
the block period never manifests, and the simulation has no model for it. Don't validate your
font strategy with a lab score — it will tell you everything is fine either way.
Chains: the kilobytes you can't see in the size column
Finally we made scripts discover each other sequentially — script 1 injects script 2, which injects script 3 — each hop under a kilobyte, ~3 KB transferred in total. Depth is the only variable:
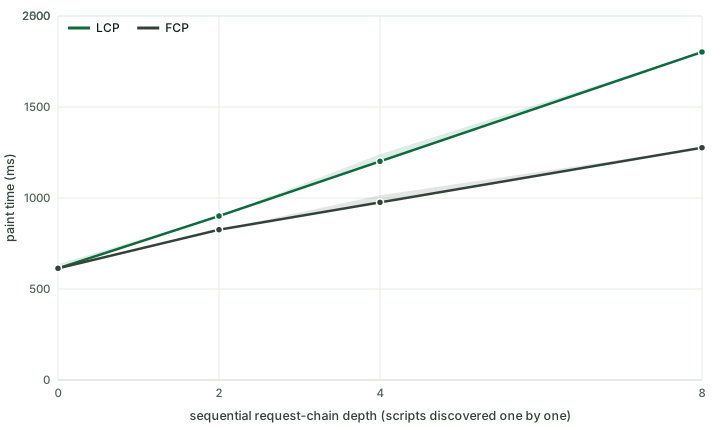
Each additional hop cost 149 ms — the fit recovers the configured 150 ms RTT within 1%. An 8-deep chain added 1.19 s to LCP while transferring 3 KB. In byte terms: on this connection one round trip is worth ~30 KB of image — so a tag manager loading a tag loading a pixel “weighs” about 90 KB while showing 2 KB in DevTools. Depth, not weight. (It's also why our budget calculator charges one full RTT per critical-path request before it allocates a single byte.)
The numbers, in one table
| What you add | What it costs | Why |
|---|---|---|
100 KB JavaScript, blocking in <head> | +521 ms LCP | transfer + parse before first paint (parse ≈ 18 ms of it) |
| 100 KB render-blocking CSS | +508 ms FCP & LCP | no paint before the CSSOM completes |
| 100 KB hero image (LCP element) | +503 ms LCP | pure transfer on a saturated link (R² = 1.0000) |
100 KB JavaScript with defer | +0.3 ms LCP | end-to-end at 1.6 MB; mid-range lab race — see Figure 2 |
| 1 extra sequential request hop | +149 ms LCP | one RTT before its first byte, regardless of payload |
| Webfonts (any count, swap or block) | +287 ms FCP, once | parallel fetches; lab is blind to font-display |
| Heavy execution in a fixed 200 KB script | +5.2 s LCP | invisible to byte budgets — and TBT recorded 0 ms |
If you remember one line: on a slow mobile connection a critical-path kilobyte costs ~5 ms whether it's JavaScript, CSS or image; a round trip costs ~30 KB; and execution can cost more than a megabyte.
Method
The design goal was isolation: if LCP moves, it must be because of the variable we moved, not a CDN's mood. Everything runs locally on one machine.
- Synthetic pages, one knob each. A ~1 KB HTML page (headline, two paragraphs) served by a local Node.js server with
Cache-Control: no-storeand no compression. Query parameters add exactly one resource type at a chosen size. - Incompressible payloads at exact sizes. Scripts and stylesheets are generated high-entropy (PRNG-derived identifiers and literals, fully parsed by the browser); images are valid PNGs padded to byte-exact sizes via metadata chunks so decode work stays constant while transfer varies. Sizes in this study are therefore wire bytes — see limitation 3.
- Lighthouse 13.4.0, default mobile profile. Simulated Slow 4G throttling (150 ms RTT, 1,638 kbps, 4× CPU via the Lantern model), Moto-G-class screen emulation — the configuration PageSpeed Insights uses for lab data. Chrome for Testing 148, headless, on Node 22.
- 30 configurations × 7 repeats = 210 runs, interleaved round-robin so host-load drift spreads across configurations instead of biasing one. We report medians with p25–p75 bands; no outlier removal. Simulated timings quantize near RTT multiples, which is why most bands are sub-millisecond — treat sub-RTT differences as not meaningful.
- Hardware calibration. Lighthouse's CPU
benchmarkIndexacross all runs: median 2,388 (p25 2,314, p75 2,450). Simulated throttling makes results largely host-independent, but we publish the index so deviations are visible. - TTFB ≈ 0 by design. A local server removes server latency from every configuration equally. Your real page pays its TTFB on top of every number here.
Limitations — read before quoting
Lab, not field
Lighthouse's simulated throttling models a single network/CPU profile; real users are a distribution, and field data (CrUX) is the ground truth. These curves describe the lab metric your Lighthouse score is computed from — ideal for budgeting and CI, not a forecast of any one user's experience. Two of our findings (the defer race billing, the
font-displayblindness) are properties of the simulation itself, and we label them as such.One page archetype
A tiny static page isolates marginal cost cleanly, but real pages overlap resources, preload, and contend for bandwidth. Interaction effects (e.g., scripts competing with the hero image) are deliberately out of scope — that's a follow-up study.
Sizes are wire bytes
Our payloads are incompressible, so 200 KB here means 200 KB transferred. Real JavaScript typically compresses ~3–4× with Brotli — translate via transfer size (what DevTools' Network tab shows), not bundle-on-disk size. Parse cost scales with decompressed bytes, but at the ~18 ms/100 KB we measured, that correction stays small; execution cost is the term that doesn't.
Pinned versions
Lighthouse 13.4.0, Chrome for Testing 148, HTTP/1.1 on localhost, no TLS. Newer Lighthouse versions re-weight scores; absolute milliseconds shift with browser releases. The shapes and ratios are the durable result, not the third significant digit.
LCP element switches in the image series
The no-image baseline's LCP element is text; image configurations' LCP element is the image. The image-series slope is therefore fitted on image points only (100 KB–4 MB), never across that switch.
Data, reproduction & citation
The complete per-run dataset and the aggregates behind every chart are published under CC BY 4.0 — reuse the numbers and charts freely with a link back to this page.
Reproducing the experiment requires Node.js ≥ 22, the lighthouse and
chrome-launcher npm packages and a Chrome/Chromium binary: serve the synthetic pages
(one ~250-line Node server: parameterized script/CSS/PNG/font/chain generators), then run Lighthouse
programmatically over the 30-configuration grid, 7 repeats, interleaved. The methodology section above
plus the dataset's column headers contain every constant needed. We link replications —
tell us about yours.
Cite this study
PageSpeedAudit Research (2026). The cost of a kilobyte: a controlled Lighthouse
experiment on the LCP price of JavaScript, CSS, images, fonts and request chains.
https://pagespeedaudit.com/research/the-cost-of-a-kilobyte

@misc{pagespeedaudit2026kilobyte,
  title  = {The cost of a kilobyte: a controlled Lighthouse experiment},
  author = {{PageSpeedAudit Research}},
  year   = {2026},
  url    = {https://pagespeedaudit.com/research/the-cost-of-a-kilobyte},
  note   = {Dataset: cost-of-a-kilobyte-runs.csv, CC BY 4.0}
}
Where is your page spending its kilobytes?
This study prices generic bytes. A PageSpeedAudit report prices yours — which resources sit on your critical path, what each fix is worth in milliseconds, and the exact code change.
Sister study: “The cost of a millisecond” grades twenty years of evidence on what that speed is actually worth in revenue.