Registered protocol · adoption-cohort design
Do WordPress speed plugins work in the field?
WP Rocket, NitroPack and LiteSpeed Cache promise to fix Core Web Vitals. Almost all the evidence offered for them is a synthetic Lighthouse score or a cross-sectional dashboard — and neither can tell you what happens to real users after a site installs one. This is the design that can: a staggered adoption-cohort event study linking HTTP Archive plugin markers to Chrome UX Report field outcomes. We publish the full protocol and a runnable replication package — and we do not fabricate the effect estimates.
Status: a registered protocol, not a results paper
This article specifies the experiment in full — detection, panel, estimator, falsification tests and decision rules — and ships the SQL, R and Python to run it against public BigQuery data. It contains no treatment-effect numbers, because the only honest way to state them is to extract the origin-month panel first. Every figure below is an explicitly-labelled design schematic. When the extraction is run, the results drop into the same tables and figures with their methodology already public — the strongest form of pre-commitment we can offer.
The question the market can't answer
WordPress speed plugins make genuine engineering interventions: full-page caching, minification,
critical-CSS generation, unused-CSS removal, lazy loading, CDN integration, image optimisation, font
optimisation, script deferral, and delaying JavaScript until the first user interaction. NitroPack
advertises caching, image and code optimisation, an integrated CDN and lazy loading; LiteSpeed Cache
separates page-optimisation features from cache features that depend on a LiteSpeed server or
QUIC.cloud; WP Rocket documents delay-JavaScript as holding script execution until interaction, tagging
delayed scripts with type="text/rocketlazyloadscript" and replacing src with
data-rocket-src.
Those interventions land in two different measurement regimes, and the regimes can disagree. PageSpeed Insights reports both: lab diagnostics from Lighthouse, collected in a controlled synthetic environment, and field data from CrUX — the real experience of Chrome users over a trailing 28-day window. Google's own documentation says the lab number is for debugging and may not capture real-world bottlenecks, while the field number is the true user experience. A plugin can therefore improve Lighthouse audits and still fail to move what users feel — because real visitors arrive on different devices and networks, with warm caches, from different countries, on product and checkout pages rather than the home page, through consent banners, ads and personalisation the lab never sees.
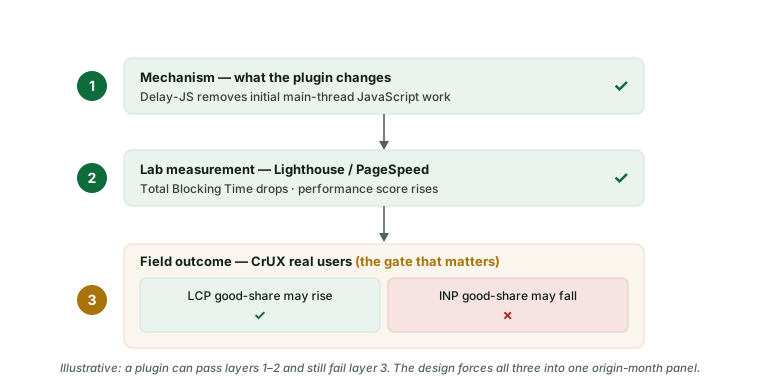
So any honest claim about a plugin has to survive three separate layers — and most marketing collapses them into one:
Why the public evidence isn't enough
- Cross-sectional dashboards aren't causal. HTTP Archive's Core Web Vitals Technology Report is a valuable public resource — it joins CrUX field metrics to HTTP Archive technology detections. But it compares sites that use a plugin to sites that don't, and those groups differ in ways that move CrUX on their own: plugin users are more performance-aware, more likely to pay for good hosting, run WooCommerce, use heavy page builders, or sell in ad- and consent-heavy verticals. A pass-rate gap can't separate the plugin from the company it keeps. The defensible question is not “do plugin users have better CWV?” but “what happened to the same sites after they adopted, versus comparable sites that didn't?”
- A lab-score uplift is a mechanism signal, not a field outcome. PageSpeed Insights reports lab and field precisely because they can diverge. A plugin can cut Total Blocking Time in a synthetic test by deferring scripts, while CrUX INP — measured across real interactions — does not improve, or regresses. The remedy isn't to adjudicate vendor disputes in prose; it's to make the field metric the primary endpoint and treat Lighthouse as a falsifiable secondary.
- WordPress Core already proved the pattern — for itself, not for plugins. The WordPress performance team has used exactly this HTTP Archive × CrUX field method to validate core releases (the WordPress 6.3 field analysis states plainly that lab benchmarks aren't representative of the average production site, and the 2024 field-research guide lays out the BigQuery workflow). The same before/after logic has never been applied systematically to commercial speed plugins — nor to delay-JavaScript after INP became a Core Web Vital in March 2024.
The gap, then, is specific and closable: the data exists, the field method is proven, and the only missing piece is a design that turns plugin adoption into a treatment event.
The design in one picture
Plugin installs are natural experiments staggered across calendar time: different origins adopt in different months. That lets us build an event study. For each treated origin we line up its CrUX outcomes by months-since-adoption, compare against matched origins that have not yet adopted, and read the treatment effect as a function of event time k. The signature of a real win is unmistakable — and so is its absence.
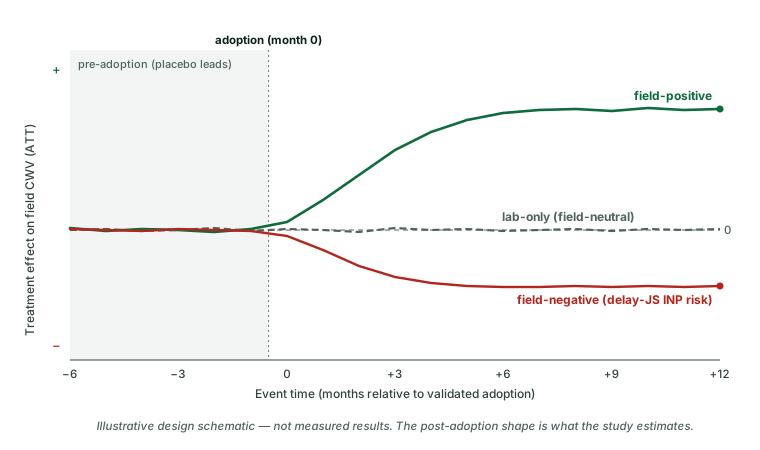
Formally, for plugin or feature p, adoption cohort g (the month a group of origins first adopts) and event time k, the primary estimand is the group-time average treatment effect on the treated:
ATT_p(g, k) = E[ Y_i,g+k(1) − Y_i,g+k(0) | G_i = g, T_i = p ]

Y         a CrUX field outcome at the origin-month-device level
G_i       origin i's first validated adoption month
Y(1),Y(0) potential outcomes with / without the plugin; the untreated
          path is estimated from matched not-yet-treated WordPress origins
The whole credibility of the answer rests on the left half of that picture. If the leads are flat — adopters look just like their controls in the six months before they install — then the jump after adoption is plausibly the plugin. If the leads already slope up, the “effect” is just performance-aware owners who were improving anyway, and the design honestly reports that the effect is not identified.
Research question & hypotheses
Question. Do WP Rocket, NitroPack, LiteSpeed Cache and delay-JavaScript-until-interaction improve CrUX field metrics after adoption, relative to matched WordPress origins that have not yet adopted the same treatment? The hypotheses are pre-committed and directional:
H1 · LCP responds most
Treatments that cut server response time, transfer size or render-blocking resources improve mobile LCP and the good-LCP share after adoption — with larger effects on origins that were poor or borderline beforehand. Loading-time mechanisms map most directly onto LCP.
H2 · INP responds least, and least predictably
Effects on INP are weaker and more heterogeneous than on LCP, because INP is set by real interactions, event handlers, long tasks, DOM size, third parties and client-side rendering — not by initial load. A caching plugin barely touches most of those.
H3 · Delay-JS is the ambiguous case
Delaying JavaScript until interaction reduces initial main-thread work and flatters lab diagnostics, but can worsen the first interaction when above-the-fold scripts are deferred. WP Rocket's own documentation warns delay-JS “can potentially have a negative effect on INP” and that scripts needed for critical interactions should be excluded. This is the cleanest test of the lab-versus-field divide on the page.
H4 · Gains are conditional, not universal
Effects vary by hosting, baseline rank, theme/page-builder stack, ad and analytics load, e-commerce status and geography. A plugin that rescues a bloated page on weak shared hosting may do almost nothing for an already-lean origin — so a single global verdict would be dishonest.
Data architecture
The analysis dataset is an origin-month panel built entirely from public BigQuery
tables — no private crawl, no vendor data. HTTP Archive supplies the technology and resource side:
httparchive.crawl.pages carries monthly page rows with rank, page summaries, Lighthouse
data and Wappalyzer-detected technologies, and httparchive.crawl.requests carries one row
per request, including response headers and text response bodies — the raw material for feature-level
markers. CrUX supplies the field side: its monthly materialised tables
(device_summary by month, origin and device; country_summary for geography)
expose good/needs-improvement/poor fractions and approximate p75 values per origin — exactly the shape
an origin-month event study needs.
The subtlety that wrecks naïve before/after comparisons is timing. An HTTP Archive crawl is a single page-load snapshot; a CrUX month is a trailing 28-day field window. The two don't line up, so the crawl month is treated as ambiguous rather than as “post”:
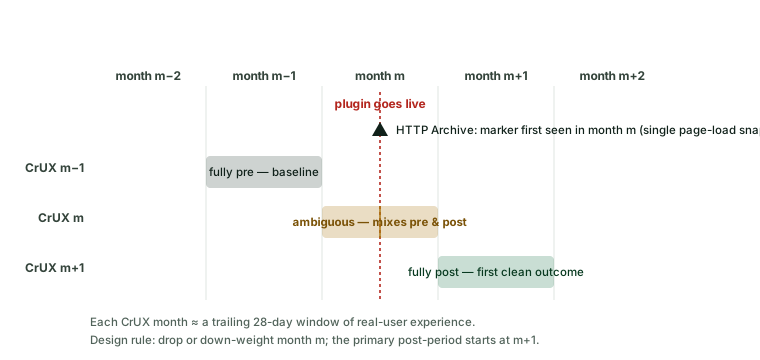
A worked example makes the rule concrete. Suppose an origin first shows the WP Rocket delay-JS markers in the June crawl. June's CrUX entry summarises real users across roughly the trailing 28 days — many of whom visited before the plugin went live. Reading June as “after” would dilute a real effect toward zero (or smear a regression). So June is the transition month, and the first outcome we trust is July (m+1). The pre-period — the placebo leads — is the spring months, which must look flat.
Form factor. Mobile/phone is the primary surface: it's the stricter performance environment, the one these plugins are marketed around, and the one HTTP Archive (mobile crawl) and CrUX (phone dimension) both cover cleanly. Desktop is secondary.
Treatment detection — and the persistence rule
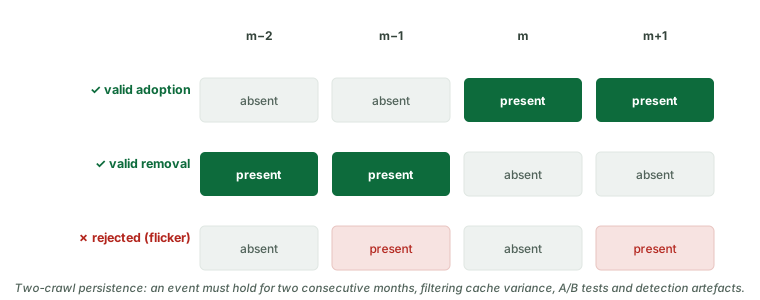
A treatment is an origin-level monthly state, not a one-off page attribute. A site counts as using plugin p in month m if Wappalyzer detects the technology, or raw HTML/header markers satisfy the plugin-specific rule. Crucially, an adoption event requires persistence — the marker must appear and stay — which strips out crawl noise, cache variance, A/B experiments and detection artefacts:
The delay-JavaScript cohort is detected separately from WP Rocket as a brand,
because its markers are unusually strong and feature-specific. WP Rocket tags every delayed script
with type="text/rocketlazyloadscript", swaps src for
data-rocket-src, and adds companion data-rocket-* attributes. The cohort is
defined by raw response-body detection of any of:
type="text/rocketlazyloadscript"   OR   data-rocket-src
data-rocket-type                   OR   data-rocket-status
For the INP analysis, the primary delay-JS cohort is restricted to outcome months of March 2024 or later, because INP officially replaced FID as a Core Web Vital on 12 March 2024. Earlier INP data is used only as a sensitivity check, with release-note checks for schema continuity. Every marker is validated before any estimate is read:
| Treatment | Primary marker family | Confidence rule |
|---|---|---|
| WP Rocket delay-JS | rocketlazyloadscript, data-rocket-* | Source-backed · two-crawl persistence + manual review |
| WP Rocket (brand) | Wappalyzer + WP Rocket body/header/path markers | High-confidence sample only; validated apart from delay-JS |
| NitroPack | Wappalyzer + candidate nitro-* / cache markers | Candidate — manual validation required before inference |
| LiteSpeed Cache | Wappalyzer + LSCache / QUIC.cloud server-cache markers | Stratify server-backed cache vs plugin-only optimisation |
The validation protocol is explicit: draw 200 positive and 200 negative origin-months per marker family, stratified by rank and month; inspect bodies and headers to estimate precision; compare Wappalyzer-only, raw-marker-only and intersection positives; treat any family below 0.95 precision as secondary or apply measurement-error correction; and re-run the event study on high-confidence detections only. Precision and recall bounds are published before the estimates are.
Outcomes & thresholds
The outcome hierarchy is fixed before any result is inspected — the discipline that stops a study from quietly migrating to whichever metric happened to move.
| Tier | Outcome | Role |
|---|---|---|
| Primary | Mobile good-LCP share & LCP pass | Loading — H1's main target |
| Primary | Mobile good-INP share & INP pass (post-Mar 2024) | Interaction — H2/H3 |
| Primary | Mobile good-CLS share & CLS pass | Stability |
| Primary | All-CWV pass (LCP, INP, CLS all Good at p75) | The headline users are sold |
| Secondary | p75 LCP / INP / CLS | Continuous effect sizes |
| Secondary | TTFB, FCP | Mechanism outcomes |
| Mechanism | Page weight, JS bytes, image bytes, requests, third-party count, Lighthouse TBT | From HTTP Archive — the lab/mechanism contrast, never the primary endpoint |
Thresholds follow Google's published Core Web Vitals definitions: Good is LCP ≤ 2,500 ms, INP ≤ 200 ms and CLS ≤ 0.1, assessed at the 75th percentile; the overall assessment passes only when all three are Good where there's sufficient data. p75 units are verified against the live CrUX schema before use.
Matching & control construction
Each adopter is compared with origins that could plausibly have adopted in the same month but didn't. Controls are WordPress origins present in both CrUX and HTTP Archive, with enough pre-treatment history, not using the focal plugin before the event — and a not-yet-treated origin stays eligible as a control only until its own adoption month. The minimum matching set:
- Timing & platform — event month, form factor, WordPress (and version band where available).
- Popularity — rank bucket or a log-rank spline.
- Baseline trajectory — pre-adoption level and six-month pre-trend for LCP, INP, CLS and all-CWV pass; baseline TTFB/FCP and page-weight/JS/image bytes.
- Stack — host/CDN/server category from headers and Wappalyzer; theme, page builder and e-commerce detections.
- Third parties — ad stack, tag manager, analytics and consent-management detections.
- Geography — baseline country/device mix where CrUX country coverage is sufficient.
The method is coarsened exact matching on event month, WordPress, rank band, baseline CWV status and host/CDN category, then nearest-neighbour propensity matching within strata. The propensity model is a balance tool, not the causal model. Balance is judged by standardised mean differences below 0.10, distributional distance, common-support and pre-treatment outcome balance — and where balance fails, the design declares the effect unidentified in that stratum rather than reporting it anyway.
Estimation strategy
Why not a plain two-way fixed-effects event study? Because adoption is staggered and effects are heterogeneous, and under those exact conditions a naïve TWFE regression uses already-treated units as controls for later-treated ones — the Goodman-Bacon decomposition shows this can flip the sign of a true effect. The primary estimator is therefore a modern group-time estimator — Callaway & Sant'Anna's group-time ATT (with not-yet-treated controls), cross-checked against Sun & Abraham's interaction-weighted event study. Plain TWFE is reported only as a diagnostic, never as the headline.
Effects are aggregated with cohort-size weights and reported dynamically for k = −6…+12, with three focal horizons: a short run (k = +1…+3, after the timing ambiguity clears), a medium run (+4…+6, after caches and image-optimisation queues settle), and persistence (+7…+12). Standard errors cluster at the origin with a block bootstrap; Benjamini-Hochberg false-discovery control spans the plugin × metric × form-factor family, while unadjusted intervals are preserved for effect-size reading. The transparent DiD representation — useful to show, not as the sole estimator — is:
Y_it = α_i + γ_t + Σ_(k ≠ −1) β_k · 1[event_time_it = k] + X_it'θ + ε_it

α_i   origin fixed effects        γ_t   calendar-month fixed effects
k=−1  omitted reference month     β_k   the event-time coefficients (leads + lags)
The coefficient plot must show leads as well as lags. A positive post-adoption estimate is not credible if the leads are already drifting up before the install — which is exactly what the next section is built to catch.
Identification threats & built-in defences
| Threat | Why it matters | Design defence |
|---|---|---|
| Selection into adoption | Performance-aware owners & better hosts adopt more | Match on rank, host/CDN, theme, baseline level & pre-trend |
| Regression to the mean | Slow sites improve regardless of any plugin | Match on pre-trend & baseline severity; placebo adoption dates |
| Simultaneous changes | Host/theme/CDN/core often change at the same time | Exclude or stratify origins with detected stack changes near the event |
| CrUX timing | Crawl month ≠ CrUX 28-day window | Omit/down-weight month m; post-period starts at m+1 |
| Detection error | Markers can be hidden, removed or falsely fired | Persistence rule, Wappalyzer × raw comparison, manual validation |
| Attrition | Origins enter/exit CrUX as traffic changes | Model inclusion; report balanced & unbalanced panels |
| Multiple treatments | Sites stack several optimisation plugins | Single-treatment primary sample; multi-treatment as a stratum |
| Geography shift | Audience mix moves p75 on its own | Use country_summary; control/stratify by geo mix |
| Field–lab mismatch | Lab gains needn't reach users | CrUX is primary; Lighthouse is falsification only |
| Staggered-DiD bias | TWFE compares to already-treated units | Group-time ATT / Sun-Abraham as primary |
Falsification & robustness
A field-positive verdict has to survive a battery of attempts to break it. These are pre-committed, not chosen after seeing results:
- Pre-trend test. Leads at k = −6…−2 must be jointly near zero. A small wiggle is fine; a monotone pre-adoption climb is disqualifying.
- Placebo adoption. Assign pseudo-adoption months to matched controls and re-estimate — placebo effects should centre on zero.
- Removal symmetry. If a plugin lifts field metrics, validated removals should attenuate or reverse the gain — strongest evidence for caching, CDN and resource-optimisation mechanisms.
- Feature contrast. WP Rocket with delay-JS vs without. If the delay-JS arm improves LCP but not INP, that's the load-versus-interaction trade-off (H3) caught in the data.
- Lab–field contrast. Run the same events against Lighthouse/TBT outcomes. The “lab-only” signature is a clear lab gain with a CrUX ATT indistinguishable from zero.
- Window & encoding sensitivity. Persistence of one/two/three crawls; windows of [−3,+6], [−6,+12], [−12,+12]; good-share vs pass-indicator vs p75 — a result that survives only one fragile encoding is downgraded.
- Cohort restrictions. Re-run excluding host/CDN or theme changes, major WordPress core-release windows, and the top-1,000 rank band where bespoke stacks dominate.
What would count as “works in the field”?
The verdict is per plugin, per metric, per stratum — and deliberately resistant to vendor-friendly rounding:
- Field-positive — post-adoption CrUX ATT is practically and statistically positive in the expected direction; pre-trends pass; removals are consistent where observable; the result survives the high-confidence marker sample.
- Field-neutral — estimates small, unstable or centred on zero after matching, even if lab metrics improved.
- Field-negative — field outcomes deteriorate after adoption; the watch case is INP for delay-JS cohorts.
- Lab-only — Lighthouse/TBT improve materially while CrUX does not move. The score went up; the users didn't notice.
- Unidentified — matching fails, markers fail validation, pre-trends fail, or simultaneous stack changes dominate. Reported as unidentified, not as zero.
A single global yes/no is unlikely to be honest. The defensible answer will be conditional — something like: plugin X lifts mobile LCP for slow shared-host origins; plugin Y has small average effects but larger ones when baseline TTFB is poor; delay-JS improves lab and sometimes LCP but is ambiguous-to-negative on INP for interaction-heavy templates. That conditional map is the product practitioners actually need.
Limitations — read before quoting
Page vs origin
HTTP Archive crawls a root page (and, since 2022, a secondary page for many origins) while CrUX is origin-level. A plugin may help product pages more than the home page, or vice-versa; the origin outcome blends them.
Coverage floors
Low-traffic origins are absent from CrUX, and CrUX reflects eligible Chrome users, not all browsers. Effects generalise to sites big enough to be measured.
Detection blind spots
Wappalyzer and raw markers can miss hidden or aggressively-optimised implementations; brand markers for NitroPack and LiteSpeed start as candidates until validated.
Configuration is partly unobservable
Plugin effects depend on settings (which caches, which exclusions) that response bodies only partly reveal — so estimates are intent-to-treat by detected state, not by optimal configuration.
It's still observational
Matching and pre-trend tests harden the design, but only a randomised install would close every door. The correct response is to validate detection, stratify hard, and refuse to generalise past identified strata — not to retreat to lab scores.
Data, code & sources
The full replication package is published under CC BY 4.0: the source registry, the marker ontology, the target panel schema, the BigQuery extraction templates, and the matching / event-study / reporting scripts — everything needed to produce the estimates this article deliberately withholds. Run it, disagree with it, or extend it to plugins we didn't cover.
Browse the artefacts
Key sources
- HTTP Archive. Core Web Vitals Technology Report & pages/requests table schemas — the cross-sectional benchmark this design improves on, and the marker source.
- Chrome UX Report. CrUX on BigQuery & methodology/tools — monthly origin/device materialised summaries and release timing.
- Google. About PageSpeed Insights — the lab-vs-field distinction and the Good thresholds (LCP ≤ 2,500 ms, INP ≤ 200 ms, CLS ≤ 0.1 at p75).
- Arntz, F. (2023, 2024). WordPress 6.3 field impact & Conducting WordPress performance research in the field — the HTTP Archive × CrUX precedent this study extends to plugins.
- WP Media. Delay JavaScript execution & Interaction to Next Paint — the delay-JS markers and WP Rocket's own INP warning.
- Wagner, J. & Viscomi, R. (2024). INP becomes a Core Web Vital on March 12 — the cohort boundary for the INP analysis.
- Callaway & Sant'Anna (2021); Sun & Abraham (2021); Goodman-Bacon (2021); Abadie & Imbens (2016) — the staggered-DiD estimators and matching basis. Full registry: source-registry.csv.
- Vendor references: NitroPack & LiteSpeed Cache feature documentation.
Cite this study
PageSpeedAudit Research (2026). Do WordPress speed plugins work in the field?
A causal adoption-cohort design for WP Rocket, NitroPack, LiteSpeed Cache and
delay-JavaScript using HTTP Archive and CrUX.
https://pagespeedaudit.com/research/do-wordpress-speed-plugins-work

@misc{pagespeedaudit2026wpplugins,
  title  = {Do WordPress speed plugins work in the field? A causal
            adoption-cohort design using HTTP Archive and CrUX},
  author = {{PageSpeedAudit Research}},
  year   = {2026},
  url    = {https://pagespeedaudit.com/research/do-wordpress-speed-plugins-work},
  note   = {Registered protocol + replication package, CC BY 4.0}
}
Free 4-part email series
The WordPress speed series
The evidence standard behind this protocol, applied to your own site — four short emails, then it stops. Email-only; not published on the site:
- Part 1The three layers every speed claim must survive — mechanism, lab, field.
- Part 2View source — what your plugin actually changed, and how to judge it in field data.
- Part 3Why "sites with plugin X have better vitals" proves nothing — and what would.
- Part 4Your WordPress PageSpeed report — which flags are Real, and the silence to check first.
Don't want to wait for the census — is your plugin working?
A PageSpeedAudit report doesn't forward a vendor's claim or a Lighthouse number. It reads your real critical path and your CrUX field data, and tells you which fixes — and which plugins — are actually moving LCP and INP for your users, and which are only moving the score. Our sister study “Do Lighthouse's promised savings materialize?” measures the same lab-vs-reality gap fix-by-fix, and the free cloaking test checks whether a “95+” is even real.