Evidence audit
The cost of a millisecond
Everyone “knows” that 100 ms is worth a few percent of revenue. We graded twenty years of the speed-versus-revenue literature by research design and found something sharper: speed really does move money, but the two cleanest causal designs put it at 0.6% and 0.7% per 100 ms — roughly an order of magnitude below the headlines everyone quotes. Their ≈0.65% midpoint is a planning reference, not a pooled estimate: the two measure different outcomes on different clocks.
The number, and the gap
Take only the publicly auditable, monetised estimates and surprisingly little survives. The cleanest slowdown experiment is Bing: −0.6% revenue per +100 ms of server delay, measured when Bing's server response was already sub-second at the 95th percentile. The cleanest peer-reviewed quasi-experiment is Gallino, Karacaoglu & Moreno (2023): ≈ −0.70% conversion per +100 ms of page-load time at their documented ~3-second baseline. Two independent designs, landing within 0.1 percentage points of each other — and not 3%, 5% or 8%.
Read those two estimands closely, because they are not the same quantity. Different outcome (revenue vs conversion), different clock (server response vs full page load), different baseline — only Gallino's is calibrated at three seconds. So their ≈0.65% midpoint is a planning reference: a defensible number to start a business case from, not a pooled causal estimate on a common scale. What carries the weight is the agreement itself. The quantity you can actually localise to your own site is Gallino's conversion elasticity; Bing is the independent check that its order of magnitude isn't an artefact of one dataset.
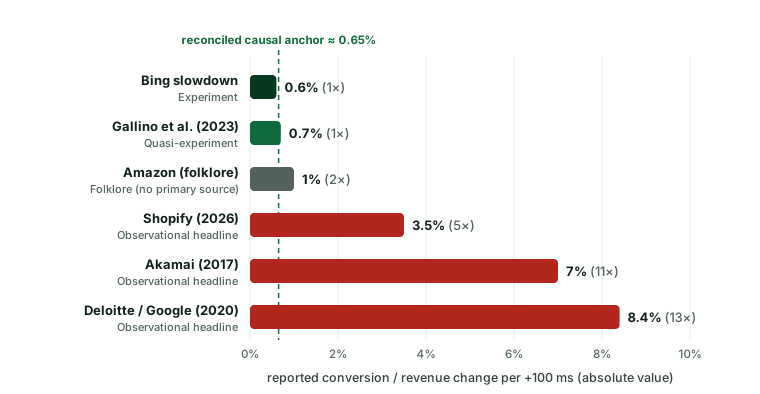
Three findings carry the audit. Speed has a real causal business effect — that part of the folklore is true, and two independent clean designs agree on its size. The effect is local, not globally linear: it depends on the baseline, the page type, the funnel step and the metric, so a single universal millisecond multiplier is a category error. And the most-marketed headlines are about an order of magnitude too high — not because anyone lied, but because they report local cross-sectional slopes, combined metrics and selectively significant results as if they were causal averages.
Why audit the evidence at all?
“Speed matters” is one of the most-cited claims in web performance, yet — as far as we can find — no systematic, design-graded review of the speed→revenue literature exists. The best-known collection, WPO Stats, is an excellent discovery tool but explicitly curates “case studies and experiments demonstrating the impact.” That makes it a showcase, not a sampling frame: it collects hits, not null results. The published record is therefore close to 100% positive — a textbook file-drawer problem.
So we did the boring thing the industry skips. We built a register of the primary and widely-cited sources we could find for 2006–2026 — a curated, design-graded register, not an exhaustive systematic search — graded each by its research design, recorded its provenance and conflicts of interest, and — only where the design supports it — placed its effect on a common per-100 ms scale. Crucially, we did not run a classical inverse-variance meta-analysis: most reports publish no standard errors, no confidence intervals, no microdata and no replication code, so a pooled average would manufacture false precision. Instead we used design-tiered triangulation — experiments, quasi-experiments, observational cross-sections and before/after case studies are judged separately, and only then compared.
What the evidence shows, tier by tier
Experiments — the strongest evidence
Real or near-real experiments deliberately slow a random slice of traffic and watch what happens. Google's 2009 slowdown (Brutlag) added 100–400 ms of server latency to web search and lost 0.2%–0.6% of searches per user; the loss grew with exposure and partly persisted after the delay was removed. That's a demand proxy, not revenue, but it has high internal validity. The monetised counterpart is the Bing slowdown A/B, reported first-hand in Kohavi, Deng, Frasca, Walker, Xu & Pohlmann (KDD 2013): they slowed 10% of users by 100 ms and another 10% by 250 ms for two weeks, and report that “every 100msec improves revenue by 0.6%.” Two details matter and are usually dropped when the figure is quoted: it is server performance that was delayed — “Bing's server performance is now sub-second at the 95th percentile” — and the outcome is revenue, not conversion. It remains the best publicly citable monetised slowdown experiment in the literature; no confidence interval, standard error or sample size is published with it.
The same paper carries the one reported null we could find in this literature, and it belongs here rather than in a footnote. Kohavi et al. write that they “were surprised to see Etsy's Dan McKinley claim that a 200msec delay did not matter,” and judge that “a more likely hypothesis is that the experiment did not have sufficient statistical power to detect the differences.” McKinley's own account is a talk and annotated slides, and is thinner still: “We ran a test where we slowed down search artificially, by adding sleeps()… Absolutely nothing happened.” He states no magnitude — the “200 msec” is Kohavi et al.'s reading of his code slide — and the thing delayed was the search endpoint, not page load. With no outcome definition, sample size, confidence interval, minimum detectable effect or baseline published, it is a reported null, not a demonstrated one, and it neither confirms nor contradicts the corridor. It is in the register anyway, because a review that attacks positive-result selection may not quietly drop the one negative result its own primary source reports.
Quasi-experiments — the best peer-reviewed evidence
Gallino, Karacaoglu & Moreno's “Need for Speed” (Operations Research, 2023) combines fixed effects and generalised synthetic control across seven apparel brands. A 10% slower site cuts conversion by about 2% and sales by about 4.2%. Its conversion model puts the coefficient on log load time at −0.218 — an implied conversion elasticity of about −0.2, which we carry as −0.21 — and at the paper's documented 2.96-second mean load time that works out to about −0.70% conversion per +100 ms. The effect is concave and uneven along the journey — stronger near checkout — which is the single most important qualifier in this whole literature.
Older econometric work reinforces the non-linearity. Poggi et al. (Information Systems Frontiers, 2014) show, for an online-travel agency, that the right question isn't “what's the universal average effect?” but “at what threshold does the system tip from tolerating into frustrated?” In their setting a tolerance zone runs from about 3 to 11 seconds; past the ~11-second frustration threshold, each additional second costs roughly 3% of sales. That's not a universal retail multiplier — it's a strong argument against linear universal-ROI calculators.
Observational headlines — useful, but not causal averages
The famous big numbers all come from observational cross-sections, and every one of them reads high for the same structural reasons (next section). The folklore tier is weaker still: Amazon's legendary “100 ms = 1% of sales” traces only to a blog post and an old slide — no paper, no dataset, no method — and Google's 2006 “half a second cost 20% of traffic” lives in conference and blog provenance, never an auditable primary. Historically important; not modern evidence anchors.
Why the big headlines overestimate
Akamai (2017) is hugely influential and worth reading closely because of it. The report says desktop conversions peak at 1.8 seconds, then explains the “up to 7% per 100 ms” effect with a slope measured around 2.7–2.8 s — and adds its own footnote that the fastest pages don't convert best because the fast tail is full of 404s and other non-converting pages. In other words, the famous “7% per 100 ms” is a local, selection-biased slope in a cross-section, not a causal average.
Deloitte/Google's “Milliseconds Make Millions” (2020) is documented more carefully than most marketing PDFs, but the +8.4% retail headline still isn't an unbiased average effect. The study was commissioned by Google, the data was supplied by a third party and — Deloitte says so plainly — not audited or validated; the published figures combine four speed metrics, and only statistically significant per-brand results were included, with null or minimal cases left out. That selective reporting is exactly what manufactures an upward-biased headline.
Shopify's 2026 platform analysis is almost a model of how to do this honestly: ~3.5% lower conversion per +100 ms of LCP, while stating outright that this is correlation, not direct causation, and showing that LCP relates to conversion far more clearly than CLS does. That intellectual honesty makes it more credible than the more aggressive claims — but it's a correlation, not an experiment, so it belongs in the observational tier all the same.
The reconciled effect — and why it's local
Average the two clean causal designs and you get the ≈0.65% reference. But the most important word in this whole audit is local. A constant elasticity produces wildly different per-100 ms numbers depending on where you start: the same −0.21 conversion elasticity that yields 0.70%/100 ms at a 3-second baseline yields about 2.1% at one second and only 0.35% at six. There is no universal millisecond multiplier; there is an elasticity that you have to localise.
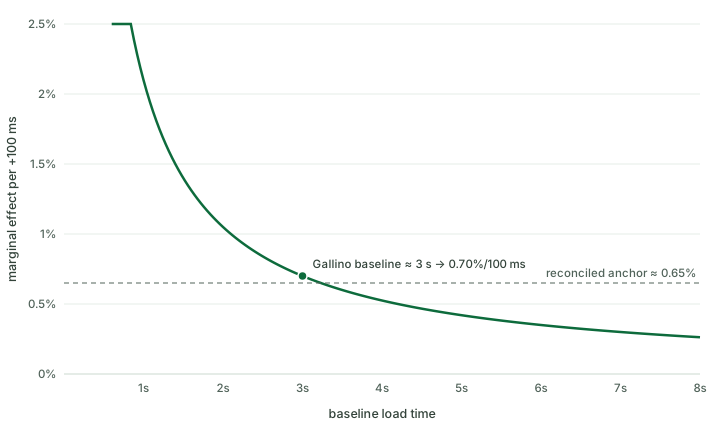
The anchor has to be bounded in three directions, or it stops being research and becomes a sales calculator:
It's baseline-local
A fixed 100 ms is worth more on an already-fast page, not less: it is a larger share of a smaller number, so the percentage effect shrinks as the baseline gets slower. Gallino's own threshold model points the same way — sensitivity decreases as load time rises (a 1% slowdown costs 0.31% of sales below their estimated threshold but only 0.18% above it). The separate case for chasing very slow pages is absolute, not relative: 100 ms is a smaller share there, but the page has whole seconds to give back. And past a frustration threshold — Poggi puts it near 11 s — the curve kinks back above what the elasticity alone predicts at that baseline; it still does not overtake the effect on a one-second page.
It's journey-specific
Deloitte/Google shows larger effects on product-detail and add-to-basket steps; Gallino finds sensitivity concentrated near the transaction. The browse page and the checkout are not the same elasticity.
It's metric-specific
LCP, INP and CLS are not interchangeable. Conflating “server processing delay,” “full page load,” “LCP” and “INP” into one pseudo-metric is how you get a headline that means nothing.
Not every metric monetises
The metric-specific point deserves its own evidence. Shopify's 2026 platform data shows that modern commercial impact runs through loading and responsiveness, not layout stability: conversion falls ~3.5% per +100 ms of LCP and ~1.5% per +32 ms of INP, while CLS shows essentially no correlation with conversion.
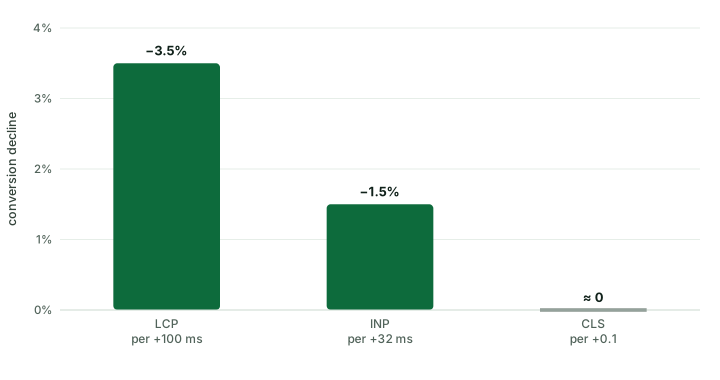
The practical reading: a perfect CLS score is worth far less to the bottom line than an LCP or INP win. Chasing the layout-shift number because it's easy is a classic case of optimising what's measurable instead of what's valuable.
What this changes in practice
The most important consequence isn't “run more tests” — it's test differently. The money probably isn't in a global site-speed average; it's in the few places where speed actually causes abandonment: the product page, the add-to-cart interaction, checkout, and mobile critical flows. So the right artefact isn't a generic performance backlog — it's a revenue-weighted performance backlog, prioritised by where the elasticity is steepest.
Concretely, that means retiring four habits:
- No more generic “7% per 100 ms” multipliers in sales decks — quote the corridor (0.5–0.8%) and localise it.
- No blending of server delay, full page load, LCP and INP into one pseudo-metric.
- No conclusions drawn from raw cross-sections without local-slope and selection context.
- No decision documents that hide null results.
Anything above the corridor needs an explicit local proof — ideally a real holdout experiment, or at least a credibly identified quasi-experiment on exactly the page type and funnel step you intend to monetise. And once you know where to spend the budget, our sister study “The cost of a kilobyte” measures what each fix is worth in milliseconds, and the free performance budget calculator turns an LCP target into the byte budget that hits it. To see this elasticity applied to a real URL — your measured LCP priced as an honest revenue range — run the free Speed → Revenue calculator.
The register, in one table
| Study | Design tier | Reported per 100 ms | Auditability |
|---|---|---|---|
| Bing slowdown A/B (Kohavi et al.) | Experiment | −0.6% revenue | High |
| Google web search (Brutlag, 2009) | Experiment | −0.2% searches* | High |
| Etsy search slowdown (McKinley, 2012) | Experiment | reported null† | Low |
| Gallino et al. (2023) | Quasi-experiment | −0.70% conversion | High |
| Poggi et al. (2014) | Quasi-experiment | non-linear (threshold) | High |
| Shopify (2026) | Observational | −3.5% conversion (LCP) | Medium |
| Akamai (2017) | Observational | up to −7% conversion | Low |
| Deloitte/Google (2020) | Observational | +8.4% conversion | Low |
| Amazon “100 ms = 1%” | Folklore | −1% sales (claimed) | None |
| Google “0.5 s = −20%” | Folklore | ≈ −4% traffic (claimed) | None |
| Vodafone (web.dev, 2020) | Before/after | not standardisable | Low |
* Demand proxy (searches per user), not revenue — shown for completeness, not folded into the monetised reference.
† The one publicly reported null. Search was deliberately slowed and the author reports that nothing happened — but no magnitude, outcome definition, sample size, confidence interval or power is published, so it is a reported null, not a demonstrated one. Kohavi et al. (KDD 2013), who report it as “a 200msec delay”, believe the experiment was underpowered.
If you remember one line: budget speed wins at roughly 0.5–0.8% of conversion or revenue per 100 ms, localise it to the page and funnel step that matters, and demand a real experiment before you believe anything bigger.
Method
- Discovery, two ways. Direct search for academic and official primary sources, plus recall over curated collections (WPO Stats) used only as a discovery aid — never as a sampling frame, because it selects for positive results.
- Design grading before numbers. Each record is tiered — experiment, quasi-experiment, observational cross-section, before/after case study, or folklore — and tagged with provenance, conflict of interest and auditability, before any effect size is trusted.
- Standardisation only where the design supports it. Monetised effects are placed on a common per-100 ms scale. Where a paper reports a log-log elasticity (e.g. Gallino's −0.21), the per-100 ms figure is the elasticity evaluated at the documented baseline; reported per-100 ms headlines are taken as published. Effects without an absolute millisecond delta (most CWV-era case studies) are listed but explicitly not standardised.
- Triangulation, not pooling. No inverse-variance meta-analysis: most sources publish no standard errors or microdata, so a pooled average would be false precision. The ≈0.65% reference is the agreement of the two cleanest independent causal designs (Bing, Gallino), not a weighted mean over the whole register — and the two do not share an estimand. Bing measures revenue against server delay; Gallino measures conversion against full page load at a documented ~3 s baseline. Their midpoint is therefore a reference value, not a pooled effect on a common scale, and the register records each row's
delay_construct,outcome_metricandbaseline_msso you can check that for yourself. - Open data. The full register and the standardised file are published below under CC BY 4.0. Every row of both files carries a
source_url, and the two join onid, so you can re-grade any record against its own source.
Limitations — read before quoting
Too few revenue RCTs
There are very few publicly replicable randomised experiments with direct revenue or conversion outcomes. The monetised reference leans on two designs (Bing, Gallino); more clean experiments would tighten it. The register is curated, not exhaustive — if you know of a study or a null we have missed, send it and we will grade and add it.
The two clean designs don't share an estimand
Bing measured revenue against server delay, from a baseline already sub-second at the 95th percentile. Gallino measured conversion against full page load, at a 2.96-second mean. They agree to within 0.1 percentage points, which is worth something — but the agreement is triangulation across two different quantities, not one estimate measured twice. Read ≈0.65% as a planning reference; the number you can localise is Gallino's conversion elasticity.
The headlines aren't causal estimates
Akamai, Deloitte/Google and Shopify are included to characterise the gap, not as causal effect sizes. They belong in the observational tier and should never be quoted as average causal effects.
Standardisation carries assumptions
Converting an elasticity to a per-100 ms figure assumes you know the baseline; converting reported headlines assumes their stated step. Both are stated per row so you can disagree with them.
INP evidence is still thin
Modern INP evidence is thinner than LCP/load-time evidence, and many strong CWV-era case studies don't publish absolute millisecond deltas — so they can't be placed on a per-100 ms scale even when the design is good.
The reference is conservative by construction
0.65% is a design-cleaned reference value, not a law of nature. Treat it as the prior you start from and then beat — or fail to beat — with a local experiment.
Data & sources
The study register and the standardised per-100 ms file are published under CC BY 4.0 — re-grade the studies, disagree with our tiers, or extend the register with new evidence.
Key sources
- Brutlag, J. (2009). Speed Matters for Google Web Search. Google.
- Kohavi, R., Deng, A., Frasca, B., Walker, T., Xu, Y. & Pohlmann, N. (2013). ‘Online Controlled Experiments at Large Scale’. KDD 2013. — the primary source for the Bing 0.6%/100 ms figure and for the Etsy null.
- McKinley, D. (2012). Design for Continuous Experimentation: Talk and Slides. Etsy. — the reported 200 ms null, as cited by Kohavi et al.
- Kohavi, R. & Thomke, S. (2017). The Surprising Power of Online Experiments. Harvard Business Review.
- Kohavi, R., Tang, D. & Xu, Y. (2020). ‘Speed Matters’, in Trustworthy Online Controlled Experiments. Cambridge University Press.
- Gallino, S., Karacaoglu, N. & Moreno, A. (2023). ‘Need for Speed: The Impact of In-Process Delays on Customer Behavior in Online Retail’. Operations Research, 71(3), 876–894.
- Poggi, N. et al. (2014). ‘A methodology for the evaluation of high response time on E-commerce users and sales’. Information Systems Frontiers, 16(5), 867–885.
- Akamai (2017). Online Retail Performance Report: Milliseconds Are Critical (19 April 2017) — the wire copy of Akamai's own release, also published by Akamai investor relations. The original
akamai.com/newsroomURL now serves a generic press-release listing rather than the release, so it is no longer usable as an evidence link. - Deloitte (2020). Milliseconds Make Millions. Commissioned by Google.
- Shopify (2026). Store Speed and Conversion: What the Data Shows.
Cite this audit
PageSpeedAudit Research (2026). The cost of a millisecond: an evidence audit of
the pagespeed-to-revenue literature, graded by research design.
https://pagespeedaudit.com/research/the-cost-of-a-millisecond

@misc{pagespeedaudit2026millisecond,
  title  = {The cost of a millisecond: an evidence audit of the
            pagespeed-to-revenue literature},
  author = {{PageSpeedAudit Research}},
  year   = {2026},
  url    = {https://pagespeedaudit.com/research/the-cost-of-a-millisecond},
  note   = {Study register: speed-revenue-study-register.csv, CC BY 4.0}
}
Find the milliseconds that actually cost you money
This audit prices speed in general. A PageSpeedAudit report finds where your critical path is slow, which fixes move LCP and INP, and what each is worth — so you can build the revenue-weighted backlog this research argues for.