Causal decomposition · open protocol
Did the web actually get faster?
Since 2023, the share of sites with “good” Core Web Vitals has climbed about 13 points — a number quoted everywhere as proof the web is improving. But during that window Google changed both the metric and the measuring instrument, so that +12.9 isn't one series: it splices FID-era months onto INP-era months. Measured on a single metric it is +14.3 points — the switch lowered the reported number, so the spliced headline understates the like-for-like move. And Google's own release notes prove a real chunk of it isn't sites getting faster at all.
The spliced headline
The raw fact is real: CrUX's headline share of origins passing Core Web Vitals rose from 43.0% in January 2023 to 55.9% in May 2026. The trap is reading that +12.9-point jump as one measurement, because in March 2024 Google replaced First Input Delay (FID) with Interaction to Next Paint (INP) as the responsiveness vital. The start of that span is on the FID basis and the end is on the INP basis: it is a splice, not a series.
INP is the stricter bar. CrUX published both headlines for seven consecutive months, August 2023 through February 2024, and the INP figure was lower every single time — by 3.2 to 3.7 points (mean 3.5), the gap narrowing as INP pass rates rose. All seven pairs are in the CSV below.
That fixes the direction. Because INP scores lower at the same date, putting the whole span on one metric raises the measured gain rather than shrinking it. From the earliest month CrUX published an INP substitution — 41.6% in August 2023 — to May 2026 the like-for-like move is +14.3 points, against +10.6 for the official headline over that identical span. Three other comparisons are worth having straight, and they are not interchangeable:
- +12.9 pp — the quoted headline, Jan 2023 → May 2026. Spliced across two metrics.
- +14.3 pp — like-for-like on INP, Aug 2023 → May 2026. No estimation needed; both endpoints published.
- +9.1 pp — the official INP era only, Mar 2024 (46.8%) → May 2026.
- +10.1 pp — Jan 2024's INP substitution (45.8%) → May 2026. This is the window the origin panel below covers, so it is the figure the decomposition targets.
What we cannot do is convert January 2023 itself to an INP basis: CrUX published no INP substitution before August 2023, and the seven observed gaps are aggregate, not a per-origin conversion factor. So there is no single “corrected 2023–2026 number,” and any source offering one is estimating.
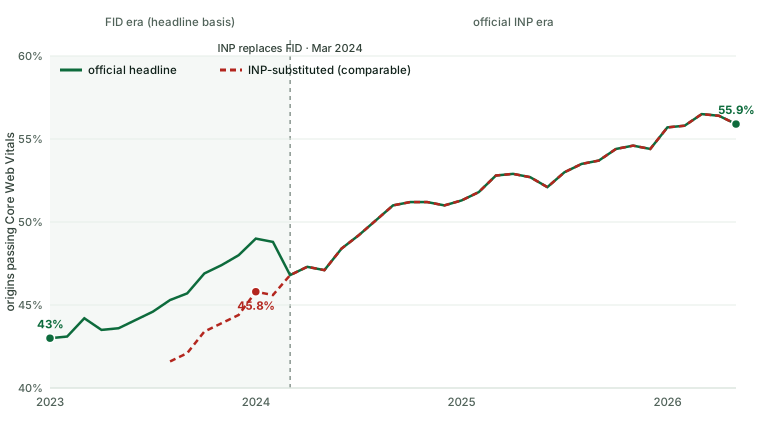
Two narratives die here. The web did not “get faster because INP replaced FID” — the switch lowered the reported pass rate. But the climb since the switch is far too big to wave away as just the transition: the official INP era alone runs +9.1 points (46.8% in March 2024 to 55.9%). The real, unresolved question is how to split a gain of that size between four very different forces — and the answer is not visible in any trend chart.
Four kinds of “faster”
“Faster” means at least four things in this literature, and they must be separated before any number means anything:
Reported faster
The official headline rises under the metric and data regime active that month. This is all a release note reports.
Metric-definition faster
The score improves because the metric changed. Excluding scroll-starting interactions from INP, for instance, removes interactions Google decided INP shouldn't measure — the number moves, the user feels nothing.
Browser-side faster
Users genuinely wait less because Chrome, Android, bfcache or the scheduler improved — with no change to the site's code.
Site/platform optimized faster
Site owners, CMSs, ad tags, CMPs or hosts changed markup, JavaScript, caching or delivery. This is the only category that answers “did websites get better?”
Only category 4 is site optimization. Category 3 is real user benefit but not the site's doing. Category 2 isn't a speed change at all. A headline number fuses all four — which is exactly why a raw year-over-year chart is methodologically unsafe when the metric definition and the instrument both move during the period being measured.
The documented shocks — and what's actually moving
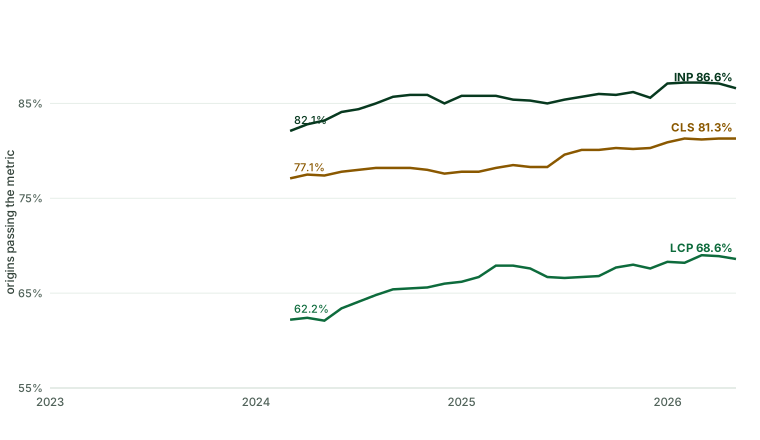
Google's own CrUX release notes and Chromium changelogs date the discontinuities. Several explicitly are not ordinary site optimization. The component view shows where the headline comes from: LCP is the main mover (≈ +6 points), with CLS and INP improving from already-high bases.
| Window | Δ | What the record attributes it to |
|---|---|---|
| FID → INP definition gap (Jan & Feb 2024) | −3.2 pp | Metric definition — a stricter bar, not a speed change |
| Jul → Sep 2024 | +1.8 pp | Mixed: INP scroll/modal exclusions + GPT yielding + LCP work |
| Feb → Mar 2025 | +1.0 pp | Browser-side: bfcache eligibility fixes by Chrome |
| Jun → Aug 2025 | +1.4 pp | Data quality: rebound after an Android data fix — not site work |
| Nov 2025 → Mar 2026 | +1.9 pp | Mixed seasonality / device / browser — unresolved |
The events sort into families: metric-definition (FID→INP; the August 2024 scroll
exclusion; the June 2024 modal-dialog timing change), browser-side (Chrome scheduler
and Android cookie-caching gains; bfcache fixes; a March 2026 Android flagship boost Google measured at
4–6% faster loads), data-quality / coverage (the 2025 Android issue and fix; the
ECT→RTT coverage change), and genuine site/platform work (WordPress LCP-image
improvements; Google Publisher Tag and consent-platform yielding; Duda removing
Cache-Control: no-store on ~40,000 origins).
A correction to a popular driver
One change is frequently miscredited: Chromium's February 2025 cross-origin LCP renderTime
fix. Its changelog states plainly that the issue “did not affect the Chrome User Experience
Report (CrUX)” and that it made RUM LCP “more in line with CrUX.” So it's a real-user-
monitoring measurement event and a negative control for CrUX — if a decomposition
attributes a 2025 CrUX LCP jump to it, the model is wrong.
Why a trend chart can't answer it — and what can
The Web Almanac's 2025 performance chapter is admirably honest: mobile CWV rose from 36% (2023) to 48% (2025), but it says that rise “may reflect browsers, devices and networks” alongside site optimization. That's the ambiguity. This study turns it into a falsifiable decomposition. Because web-platform events hit all Chrome users at once, there's no clean control group — so the design leans on exposure gradients and negative controls, not naïve before/after.
An origin-month panel
Pull
chrome-ux-report.materialized.metrics_summaryfor every origin, Jan 2024–May 2026, and define pass/fail per metric at the 75%-good threshold — avoiding fragile p75 units.Constant-origin, not all-origin
Run every model three ways: all reported origins, a constant-origin panel (present every month), and balanced-by-rank/device. Composition = (all-origin Δ) − (constant-origin Δ) — reported explicitly, never as “optimization.”
Exposure-gradient event studies
Each event gets an exposure proxy and a negative control: the Android data fix should load on phone density, with desktop as control; bfcache should help most where back/forward traffic is high; the cross-origin LCP change should produce no CrUX move (a falsification test).
Additive + Shapley decomposition
Because windows overlap, allocate the +10.1 points of the panel window (January 2024 → May 2026) across metric-definition, data-quality, browser/device, site/platform, composition and an unexplained residual using order-averaged (Shapley) shares — so the result doesn't depend on which overlapping cause is counted first.
The reproducibility pack below ships the exact BigQuery extraction, the constant-origin panel
construction, the exposure-feature SQL, a CSV export step, and an R/fixest
event-study skeleton — enough to reproduce the three exposure-gradient models, not the full
allocation, which is specified rather than coded. The shares themselves are deliberately
not estimated here: guessing them from aggregate monthly notes would be the exact
error this paper exists to prevent.
| Component of the +10.1 pp (Jan 2024 → May 2026) | Share | Identification basis |
|---|---|---|
| Metric definition & scoring | — | FID/INP paired gap; INP scroll/modal exposure |
| Data quality & coverage | — | Android fix; ECT/RTT constant-coverage checks |
| Browser / device real speed | — | bfcache, scheduler, Android exposure models |
| Explicit site/platform changes | — | WordPress / GPT / CMP / Duda technology strata |
| Residual site optimization | — | residual after event families + composition |
| Origin-set composition | — | all-origin minus constant-origin |
What it means for performance teams
The decomposition isn't academic — it changes what you do:
- Don't lower your budget on a YoY win. If much of an improvement is metric or browser change, your site didn't actually get faster — cutting the performance budget banks a gain you never made.
- Govern platform defaults, not just pages. If gains concentrate in WordPress, GPT or Duda defaults, the lever is vendor/default governance, not another one-off audit.
- Check bfcache before another image sprint. If browser navigation-cache fixes explain a chunk, removing bfcache blockers (
no-store,unload) is higher-return than re-compressing images. - Label composition on dashboards. If origin churn explains movement, a public “web got faster” chart should say so rather than celebrating optimization that didn't happen.
And it reframes the speed-vs-revenue question our sister study “The cost of a millisecond” tackles: if your CrUX improved but the cause was a browser change, don't expect the conversion lift a real site optimization would have bought.
Limitations — read before quoting
The causal shares are not estimated here
This article establishes the descriptive accounting — which comparisons the published series does and does not support — and the design. The numeric decomposition requires running the supplied origin-panel models on CrUX BigQuery; treat the table above as a specification, not a result.
No randomized control
Web-platform and metric events are global. Identification rests on exposure gradients and negative controls; aggregate interrupted-time-series alone is weak evidence and is labelled as such.
CrUX is Chrome-only and eligibility-gated
It excludes Chrome on iOS, WebView and other browsers, and origins enter/leave as popularity/eligibility shifts — which is precisely why constant-origin and composition panels are mandatory.
Endpoint sensitivity
May 2026 carries a documented, unexplained Android-heavy regression; March 2026 (56.5%) is the local maximum. Headline deltas should be reported against both endpoints.
The series is source-coded by hand
The headline numbers are transcribed from monthly release notes (spot-checked against the live notes — e.g. May 2026's 68.6/81.3/86.6/55.9 components match exactly). The published CSV lets you re-verify every row.
Data, code & sources
The reproducibility pack is published under
CC BY 4.0: the
source-coded headline series, the dated event ledger, the window accounting, the BigQuery extraction
(panel, constant-origin panel, exposure features and a CSV export step), and an
R/fixest event-study skeleton that runs the three exposure-gradient models.
Be clear about what that is and isn't: it is the extraction and the event-study layer. The
balanced-panel runs, the technology strata and the additive/Shapley allocation described above are
specified here but not implemented in the shipped code — you would write them.
Key sources
- Chrome UX Report. Release notes, methodology & CrUX on BigQuery.
- Pollard, B. & Henkel, J. (2025). LCP image subparts and RTT now available in CrUX. Chrome for Developers.
- Chromium (2024). INP changes in Chrome 128 (scroll-starting exclusion).
- Chromium (2025). Cross-origin LCP renderTime change — “did not affect CrUX” (the negative control).
- Pollard, B. & Wagner, J. (2025). Time to First Byte. web.dev (Early Hints; Chrome 133 responseStart revert).
- Seckler, E. (2026). Android Sets New Record for Mobile Web Performance. Google Chromium Blog.
- Jariyal, H. et al. (2026). Performance. The Web Almanac 2025, HTTP Archive.
Cite this study
PageSpeedAudit Research (2026). Did the web actually get faster? A causal
decomposition framework for 2023-2026 Core Web Vitals improvement.
https://pagespeedaudit.com/research/did-the-web-get-faster

@misc{pagespeedaudit2026webfaster,
  title  = {Did the web actually get faster? A causal decomposition framework
            for 2023-2026 Core Web Vitals improvement},
  author = {{PageSpeedAudit Research}},
  year   = {2026},
  url    = {https://pagespeedaudit.com/research/did-the-web-get-faster},
  note   = {Headline series + event ledger + BigQuery/R code, CC BY 4.0}
}
Is your site actually faster — or did the metric move?
A PageSpeedAudit report separates real, code-level wins from measurement and browser effects, and tells you which fixes will move your field metrics. See also our study on whether Lighthouse's predicted savings materialize, and the free cloaking test.