Source-derived model + preregistration-ready benchmark
Do soft navigations repay the slow first load?
Single-page apps are sold on a bargain: accept a heavier first load, and get faster in-app navigations back. Until Chrome's soft-navigation API made route changes measurable, that trade was almost impossible to audit. So we did the accounting. Using real RUM-Archive ratios, the break-even is unforgiving — and it does not depend on a benchmark nobody has run yet.
What this is — and what it isn't
Two questions get conflated in the SPA debate. (1) Are soft navigations faster than the equivalent MPA navigation? That needs a matched benchmark — and we specify one in full but do not fake its results. (2) Even when soft navigations are faster, do real sessions contain enough of them to repay the first-load penalty? That one we can answer now, from published data, with a transparent model. This article keeps the two strictly separate: a source-derived amortization result you can reproduce from a one-line equation, plus the full benchmark design needed to close the speed comparison.
The bargain, and the measurement gap that hid it
For years the SPA-versus-MPA argument was fought with one eye closed. The initial document load was visible to every tool; route transitions inside a long-lived JavaScript app were not measured the same way. That asymmetry let both sides be right about different halves of the same session — an advocate could point to snappy later navigations, a critic to a heavy first load with hydration and interaction cost, and neither could settle it. The WICG soft-navigation spec states the gap plainly: existing performance APIs had no way to separate SPA route changes from the initial navigation, and LCP, FCP and CLS were tied to the page lifecycle rather than to later in-app navigations.
Chrome's final soft-navigation origin trial — running Chrome 147 through 149 — closes
it. It emits a soft-navigation entry when a route change satisfies the soft-navigation criteria (a user
interaction, a URL change and a visible paint), and adds a navigationId to
largest-contentful-paint, interaction-contentful-paint,
event-timing and layout-shift entries so paints, shifts and interactions can be
attributed to the specific route that produced them. That is exactly the instrumentation an honest
amortization test needs.
The API moved after we published — read this before instrumenting
This surface is still changing, and two of the changes break code written against the trial shape.
Chrome 150 renamed the entry interface to PerformanceSoftNavigation and
replaced the largestInteractionContentfulPaint attribute with a
getLargestInteractionContentfulPaint() method; Chrome's docs now target
enabling the feature by default in Chrome 151.
More consequential for measurement: an interaction-contentful-paint entry
can be emitted before the URL update, in which case its navigationId
belongs to the previous route. Chrome therefore instructs implementers to map ICP entries to
soft navigations by interactionId, not navigationId.
navigationId remains the right key for largest-contentful-paint,
layout-shift and event-timing. Chrome 148 additionally shipped a fix for
incorrect NavigationId values on interaction-contentful-paint entries, so
Chrome 147 data must not be pooled with 148+ without a version split.
The benchmark protocol below is written against this corrected shape. Sources: Chrome soft-navigation docs and the Chromium soft-navigation metrics changelog.
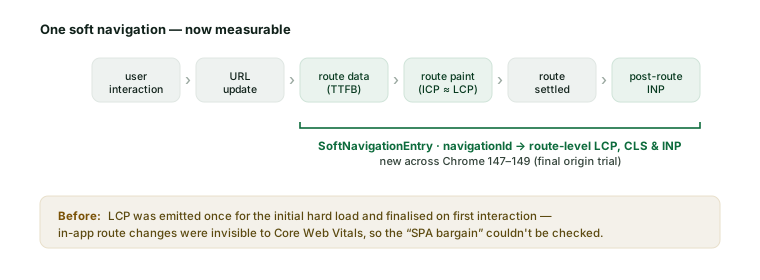
The real question, then, is not “SPA or MPA?” in the abstract. It is an amortization question: does the cumulative saving from soft navigations exceed the first-load penalty, within the real distribution of session depths?
What the evidence already shows: soft navigations are scarce
The amortization question has a load-bearing input we can read off published data — not session depth itself, which the public data cannot give, but the aggregate rate that bounds it: how many soft navigations the measured SPA traffic produces per hard load. Alex Russell's 2025 analysis is blunt — multiple independent datasets indicate that sites built as SPAs receive, on average, only about one soft navigation for every hard page load. His RUM Archive charts put numbers on it: of all measured navigations, SPA hard loads and SPA soft navigations occur at nearly the same rate.
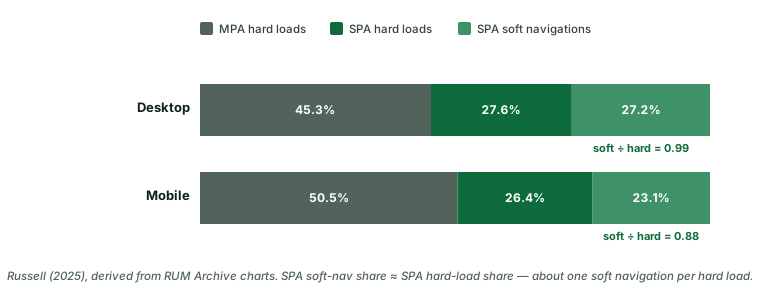
About one follow-on navigation per hard load is not much room in which to repay a heavy first load. That single fact is what makes the bargain fragile — and it's enough to compute the average-session break-even before anyone runs a speed benchmark. It is not enough to say how many individual sessions repay: the same ratio is consistent with very different session-depth distributions, which is why the benchmark below re-estimates K per segment rather than reusing this number.
The break-even model
Let P be the SPA first-load penalty versus the matched MPA; Δ the average saving of a soft navigation versus the equivalent MPA navigation; and K the number of follow-on navigations in the session. The bargain pays off only when the savings repay the penalty:
P  ≤  Σ Δ_i                 the penalty is repaid by the follow-on savings
K  ≥  P / Δ                 follow-on navigations needed (constant Δ)
D* =  1 + P / Δ             break-even session depth (load + follow-ons)

Δ_required = P / r          required per-nav saving, using r ≈ E[follow-on navs]
The last line is the whole argument. If a session contains on average r follow-on navigations,
then to repay a penalty P the average soft navigation must save at least
P / r. Because r is slightly below one on the public web, the
required saving is slightly above the entire penalty — every navigation has to give back more
than the first load cost. This turns a vague promise (“routes feel snappier”) into a falsifiable test
any team can apply before choosing a framework.
Source-derived results
Plugging Russell's ratios (desktop r = 27.2 ⁄ 27.6 ≈ 0.986; mobile r = 23.1 ⁄ 26.4
= 0.875) into Δ_required = P / r gives the required per-navigation saving for common
first-load penalties:
| SPA first-load penalty P | Desktop break-even (r ≈ 0.986) | Mobile break-even (r = 0.875) |
|---|---|---|
| 250 ms | 254 ms | 286 ms |
| 500 ms | 507 ms | 571 ms |
| 1,000 ms | 1,015 ms | 1,143 ms |
| 1,500 ms | 1,522 ms | 1,714 ms |
| 2,000 ms | 2,029 ms | 2,286 ms |
| 3,000 ms | 3,044 ms | 3,429 ms |
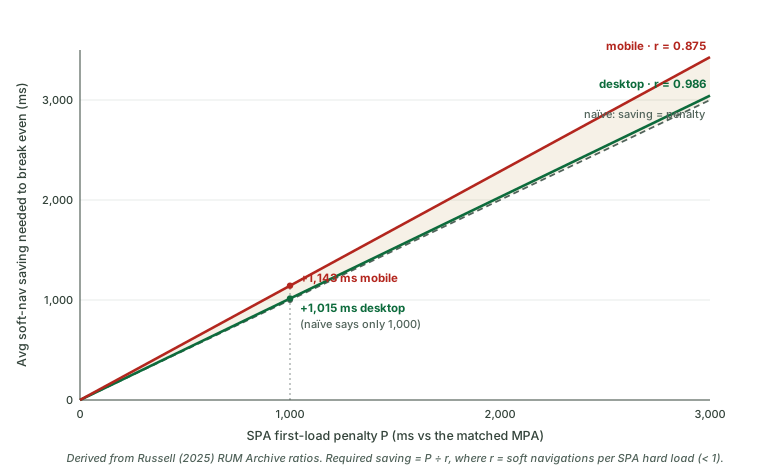
The implication is severe and specific. This is not “SPAs are slow.” It is: at the observed shallow-session ratios, a large first-load penalty must be repaid almost immediately, by a per-navigation saving as big as the penalty itself. Mobile — lower ratio, weaker devices — needs the biggest savings of all, which is precisely where soft-navigation JavaScript work is hardest to make cheap.
Reading the ledger
Think of a session as a ledger that opens in the red by the first-load penalty and is paid down by each follow-on saving. Whether it ever reaches break-even depends on two things the team controls only partly: how big each saving is, and how many navigations the user actually makes.
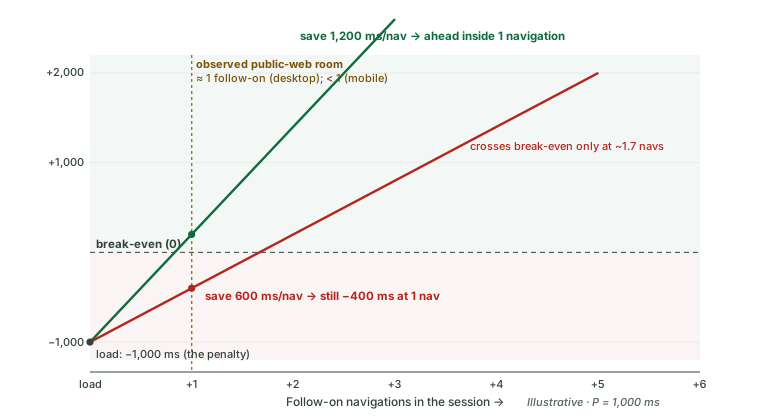
That picture is the segment story in one image — and the segment rows below are hypotheses to test against your own RUM, not measurements: the published ratios are device aggregates and carry no vertical breakdown. Where K is small, the bargain needs an implausibly large per-navigation win. Where K is large — a tool people live in for an hour — even modest per-route savings compound into a decisive lead. So the decision is not architectural taste; it is whether your segment supplies enough follow-on navigations to clear your own penalty:
| Segment | Expected follow-on depth (hypothesis) | The bargain… |
|---|---|---|
| Content, landing, news, docs, SEO acquisition | Shallow (≈1 or fewer) | rarely holds unless the penalty is tiny |
| E-commerce category → product → cart journeys | Shallow–moderate | conditional — must be measured, not assumed |
| Authenticated tools, editors, dashboards, workspaces | Deep (many) | can hold — confirm with route-level metrics |
Why a fast soft-nav TTFB isn't the win
A tempting shortcut is to measure soft-navigation TTFB — the route's data fetch — and declare victory, because it's usually far smaller than a full page load's TTFB. That's a trap. As the soft-navigation TTFB work (Hofman, 2023) and DebugBear's monitoring write-ups document, soft-nav TTFB attribution is genuinely hard: some soft navigations issue no fetch, some issue many candidate fetches, and frameworks differ in how route data is requested. More importantly, a quick data fetch says nothing about when the route actually paints — JavaScript execution, hydration, rendering and layout can all land the visible result late.
So the amortization test's Δ must be a user-perceived quantity: route-level LCP or
interaction-contentful-paint, CLS within the route window, and post-navigation INP — not route TTFB.
The new navigationId attribution is what makes those route-level metrics collectable in
the first place. TTFB is at best a secondary diagnostic.
The MPA baseline moved — the test has to move with it
Even a real soft-navigation saving is measured against a counterfactual, and the honest counterfactual is no longer “an old-fashioned full reload.” Modern multi-page apps get platform help that makes document navigations fast or instant:
- Back/forward cache (bfcache) serves instant back/forward navigations from a frozen page snapshot.
- Speculation rules prefetch or prerender likely next documents, so a click can paint immediately.
- Cross-document view transitions give MPAs the animated, app-like route change that used to be an SPA-only flourish.
- The Navigation API (now Baseline) gives MPAs and SPAs alike a clean, interceptable navigation model.
A fair benchmark therefore can't compare an SPA only to an unoptimised MPA; it has to include a modern, enhanced MPA arm. Against that baseline the soft-navigation saving Δ shrinks — and the break-even gets harder still, because a prerendered MPA navigation can itself be near-instant.
The benchmark we'd run to close the speed question
The amortization result above stands on published data. The remaining piece — the actual per-navigation speed comparison — needs a controlled study, specified here so it can be executed, audited or disputed. It is deliberately two-armed to defuse the “bad site vs good site” confound:
Arm A · natural matched pairs
50 SPA journeys and 50 MPA journeys, matched on task class, page-weight band, vertical, content complexity, geography, hosting region and third-party intensity. A “journey” is a scripted multi-step flow (landing → category → detail → form), not a single page.
Arm B · controlled paired builds
The same journeys built as paired SPA and MPA versions from one content model, API-latency model, component library and visual design — across React, Vue/Nuxt, Angular and a vanilla/platform family — so architecture is the only thing that differs. Each MPA appears in both a baseline and an enhanced (bfcache/speculation/view-transitions) condition.
Route-level instrumentation
Per navigation: hard-nav TTFB/FCP/LCP/CLS/INP, transfer and JS bytes, main-thread blocking and long tasks;
PerformanceSoftNavigationentries;getLargestInteractionContentfulPaint();navigationId-keyed attribution forlargest-contentful-paint,layout-shiftandevent-timing, andinteractionId-keyed mapping for interaction-contentful-paint — plus trace markers from route intent to first successful post-route interaction, and a recorded Chrome version per run (147 is not pooled with 148+).The right estimand
Not average page-load time, and not the gap between the two arms' own p75s. The primary estimand is the p75 of the paired route-level deltas — for each matched route pair, MPA-equivalent navigation minus SPA soft navigation — on route LCP/contentful-paint and post-route INP, with cluster-bootstrap intervals. The difference of marginal quantiles,
Q₇₅(MPA) − Q₇₅(SPA), is a different quantity and is reported only as a secondary descriptive.Pre-registered discipline
Paired (not unpaired framework averages), hierarchical (journey in site, site in framework family), with exclusions fixed in advance — navigation failure, route mismatch, missing instrumentation — and a strict rule: never exclude a run for being “slow,” and never fill the journey registry after seeing results. The registry ships as a blank template on purpose — filling and freezing it is the registration step, and it has not been taken yet.
Threats to validity
- Benchmark unfairness. SPA and MPA aren't single technologies — they're bundles of caching, rendering, bundling and third-party choices. The two-arm design (real matched pairs + controlled paired builds) is the defence.
- Metric mismatch. A fast route data fetch can hide a late paint. Route-level paint and interaction metrics are primary; soft-nav TTFB is secondary.
- Session-depth aggregation. The RUM Archive ratios are aggregated, anonymised beacon shares — an event-weighted proxy, not a user-level session-depth histogram, and the published data contain no per-session records from which one could be rebuilt. The ratio does not identify the distribution: 100 hard loads and 99 soft navigations are equally consistent with “99 sessions have one follow-on” and with “one session has 99 and the other 99 have none” — same ratio, opposite answer to “does a typical session repay?”. It pins E[K] under stated assumptions (one hard beacon per session, equal capture rates for hard and soft events), nothing more. A production study should re-estimate the whole K distribution from first-party RUM by segment.
- Source population. The RUM Archive's mPulse dataset is a random percentage of normalised data from mPulse's top 100 customers — a large, useful sample, but not a probability sample of the public web. Read the ratios as “these sites' traffic,” and treat every extension to particular verticals as a hypothesis for the benchmark, not a finding.
- An unfair MPA baseline. Because bfcache, speculation rules, prerendering and view transitions exist, the benchmark must include both baseline and enhanced-MPA conditions or it flatters the SPA.
The practical decision rule
For a product team choosing an architecture, the gate is four measurements and one inequality:
Measure P
The SPA first-load penalty against a matched MPA or server-rendered alternative.
Measure Δ — paint, not TTFB
The route-level soft-navigation saving in LCP/contentful-paint and post-route INP, against the same MPA.
Estimate K by segment
The real follow-on navigation count for your traffic, from first-party RUM — not the public average.
Apply the gate, twice
Compute the net outcome per session —
A = P − Σ Δ_i— and then pick your criterion deliberately.P ≤ E[K] × E[Δ]is the average-session gate; it can pass while most sessions still lose, and it is only exact when session depth and per-route saving are uncorrelated. If you care about the typical user, requiremedian(A) ≤ 0; for the tail,Q₇₅(A) ≤ 0. Then re-run whichever you chose against an enhanced MPA baseline, because that's the counterfactual your users actually have.
The rule of thumb from the source-derived ratios is uncomfortable for the default: across the measured SPA traffic, desktop gets about one follow-on navigation of repayment room per hard load and mobile gets under one. Deep authenticated apps are where the bargain can genuinely pay — and even there, only if route-level paint and interaction metrics confirm it. For content, acquisition and SEO flows, “soft navigations repay the slow first load” should be treated as an unproven promise until measured.
Limitations — read before quoting
The speed saving is not yet measured
This article derives the break-even from published session ratios; it does not claim a measured Δ. The benchmark above exists precisely to supply it. Treat the result as “how big a saving the bargain requires,” not “how big the saving is.”
Aggregated ratios, not your sessions
The RUM Archive shares are device-aggregated beacon proportions. Your segment may be deeper (a SaaS editor) or shallower (a landing page). The model is a calculator; K is the input you must supply.
Chart values are image-derived
The exact 27.6 / 27.2 / 26.4 / 23.1 shares are read from Russell's published charts; the headline ~1:1 ratio is stated in his text. We carry the precise figures as source-derived proxies, not as our own measurement.
A constant-Δ simplification
The closed form assumes a stable average saving per navigation. Real savings vary by route; the full sensitivity grid in the pack relaxes this across a range of P and Δ.
Data, code & sources
The full pack is published under CC BY 4.0: the source-derived RUM ratios, the compact break-even table, the full amortization sensitivity grid, the deterministic reproduction script, and the 50-pair benchmark registry template. The model is a one-line equation — you can check every number.
Browse the artefacts
Key sources
- Russell, A. (2025). The curious case of the shallow session: SPAs, PerfPlanet — the ~1 soft navigation per hard load finding and the RUM Archive navigation-mix charts.
- Google Chrome (2026). Final soft navigations origin trial (Chrome 147–149) & Soft navigations docs —
SoftNavigationEntry,navigationId, interaction-contentful-paint. - WICG. Soft Navigations specification — the measurement gap and the attribution model.
- RUM Archive. Methodology & datasets — the data are aggregated, anonymised beacon shares (the proxy caveat), and the mPulse set is “a random percentage of normalized data from mPulse’s top 100 customers” (the sampling-frame caveat).
- Hofman, R. (2023). Soft navigations & SPA TTFB, and DebugBear. Soft navigations / SPA monitoring — why soft-nav TTFB is not the win.
- The enhanced-MPA counterfactual: web.dev bfcache; Chrome speculation rules & cross-document view transitions; web.dev Navigation API (Baseline). Full registry: sources.json.
Cite this study
PageSpeedAudit Research (2026). Do soft navigations repay the slow first load?
The SPA bargain under soft-navigation measurement.
https://pagespeedaudit.com/research/do-soft-navigations-repay-the-first-load

@misc{pagespeedaudit2026spabargain,
  title  = {Do soft navigations repay the slow first load? The SPA bargain
            under soft-navigation measurement},
  author = {{PageSpeedAudit Research}},
  year   = {2026},
  url    = {https://pagespeedaudit.com/research/do-soft-navigations-repay-the-first-load},
  note   = {Source-derived break-even model + preregistration-ready benchmark design, CC BY 4.0}
}
Is your SPA's bargain actually paying off?
A PageSpeedAudit report measures your real first-load penalty against a server-rendered counterfactual and — as soft-navigation metrics reach stable Chrome — your route-level savings, so you know whether the trade clears its own break-even for your traffic. Pair it with “The cost of a millisecond” (what the saved time is worth) and “The cost of a kilobyte” (where first-load penalties come from).