INP-era replication framework + divergence taxonomy
When does lab predict field?
A green Lighthouse score and a passing Core Web Vitals grade are not the same thing — and the gap between them isn't random noise. We reframe the lab-versus-field question as a transportability problem: a lab result predicts a field outcome only when the measured URL, device, navigation state, geography, time window and performance mechanism match the real users CrUX summarises. When they don't, the disagreement itself tells you which mechanism failed.
What this is
A research-grade framework and an executable design — pre-analysis plan, data model,
divergence taxonomy and a reproducibility kit (BigQuery panel templates, a deterministic classifier,
a calibration-first modelling protocol) over public CrUX and HTTP Archive / Lighthouse. The Python
runs as published; the SQL is parameterised on your own PROJECT.DATASET and needs a
BigQuery project with access to the public datasets, so it is a template you point at your project
rather than a script that runs untouched.
It reports verified public facts and does not invent a headline
correlation for a BigQuery run nobody has executed yet. The contribution is the method that
turns lab-field disagreement from a nuisance into a diagnosis.
The problem: a high score is not a pass
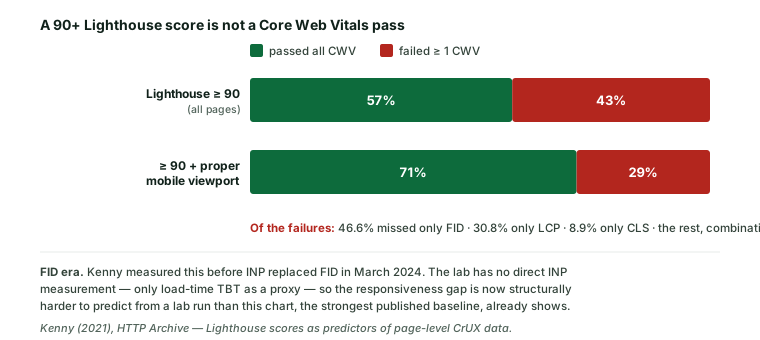
The starting evidence is now five years old and still unbeaten as a baseline. In 2021 Brendan Kenny joined Lighthouse and CrUX at HTTP Archive scale and found that a high Lighthouse score raises the probability of passing Core Web Vitals but does not guarantee it — 43% of pages scoring 90 or above failed at least one Core Web Vital. Philip Walton turned that into a challenge to the whole field: lab tools are useful, but they have blind spots and cannot be treated as equivalent to real-user data.
Why the gap reopened with INP
In March 2024, Interaction to Next Paint replaced First Input Delay as the responsiveness Core Web Vital. FID measured only the delay before the first interaction was handled — a quantity a load-time tool can approximate. INP measures the full interaction lifecycle — input delay, processing and presentation — across every interaction in the session: menu opens, search, filters, carousels, checkout, cookie banners, ad callbacks.
Here's the structural problem. The lab runs everyone actually reads carry no INP
measurement. Lighthouse does ship an interaction-to-next-paint audit, but it is
supported only in timespan (user-flow) mode, where it measures the interactions your script
actually performs. Navigation-mode Lighthouse — which is what PageSpeed Insights lab runs and the
HTTP Archive page-load crawls execute — performs no representative interactions, so it reports no
INP; its responsiveness signal is Total Blocking Time, a load-time, main-thread-blocking proxy that
carries 30% of the performance score. But TBT measures work during page load, while INP is set by work that
happens after load, when the user interacts. The two can disagree in both directions, and
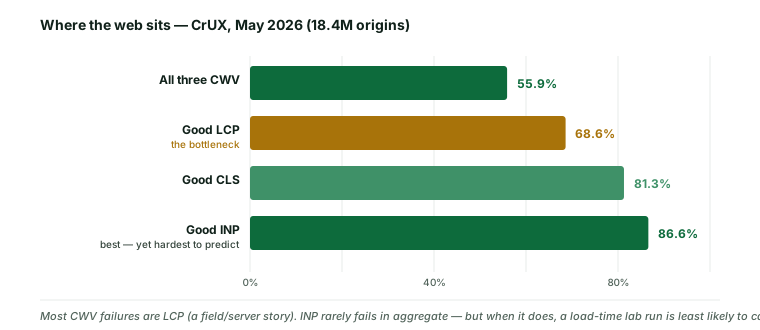
the May-2026 CrUX numbers sharpen the point: INP is the best-passing CWV in aggregate
(86.6% good), yet it's the one the lab is structurally worst at predicting — so when a site does
have an INP problem, a green lab run is most likely to miss it.
Lab predicts field only when four gates hold
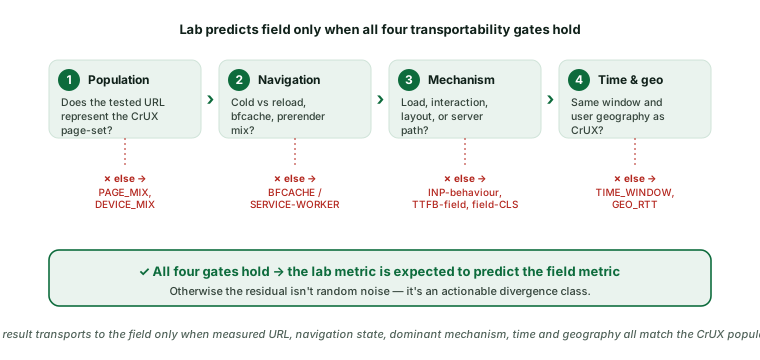
The method is to stop asking “is the lab right?” and instead ask “does this lab measurement transport to the CrUX population?” That holds only when four gates are all satisfied. Pass them, and the lab metric should track the field metric tightly. Fail one, and the residual is a named divergence class — a diagnosis, not noise.
The divergence taxonomy
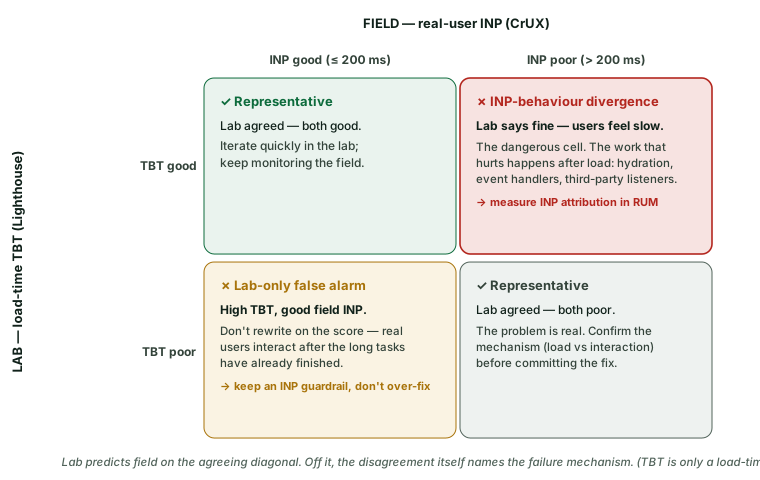
When a gate fails, the lab-field pattern falls into one of twelve classes. The taxonomy is built to be falsifiable and machine-readable: a class is assigned only when a specific lab-field pattern, an observable diagnostic, and a minimum evidence standard are all met — never because it sounds plausible. The most important case in the INP era is the top-right cell below: the lab looks fine and real users don't.
| Class | Lab → field pattern | Key diagnostic | First response |
|---|---|---|---|
| Representative | Both pass or both fail, within tolerance | Low page-mix entropy; cold nav dominant; stable TTFB/RTT | Iterate in the lab; keep monitoring the field |
| TTFB-field | Lab LCP good, field LCP poor | Poor CrUX TTFB/RTT; cache-miss signatures; geo variance | Segment TTFB by country; fix the server path before image micro-optimisation |
| INP-behaviour | Lab TBT good, field INP poor | Low TBT but poor CrUX INP; hydration; interaction-heavy templates | Measure INP attribution in RUM; reduce long tasks near real interactions |
| TBT false alarm | Lab TBT poor, field INP good | High TBT; good INP; late first interaction; low interaction rate | Don't ship a score-driven rewrite; keep an INP guardrail |
| CLS lab-only | Lab CLS poor, field CLS good | Lab filmstrip shift; consent/viewport/cookie-state mismatch | Replay consent and viewport states; reserve space only for real field shifts |
| CLS field-only | Lab CLS good, field CLS poor | Late ads, embeds, personalisation, font swaps, injected content | Collect layout-shift attribution; reserve slots; constrain embeds |
| bfcache / SW | Cold lab disagrees with warm field (either direction) | High back/forward-cache, reload or prerender navigation share | Run cold and warm profiles; inspect navigation_types |
| Geo / RTT | Single-region lab disagrees with field | Large country mix; high RTT p75; CDN region gaps | Weight lab geographies by CrUX traffic; test high-volume poor countries |
| Device mix | Lab device profile disagrees with field | CPU-sensitive JS; field hardware distribution differs | Use a low/mid/high device matrix; prioritise field RUM by device class |
| Page mix | Homepage lab disagrees with origin-level CrUX | Many high-traffic templates; homepage low-traffic; SPA routes | Build a template-weighted lab sample; avoid homepage-only claims |
| Time window | Current lab disagrees with the 28-day field window | Recent deploy/incident; CrUX rolling-window inertia | Align by date; use RUM now; forecast the next CrUX windows |
| Content variance | High lab-run variance; inconsistent field segments | A/B tests, consent, ads, personalisation, logged-in state | Record variants; stratify; repeat lab n ≥ 9; report uncertainty |
Three estimands you must not conflate
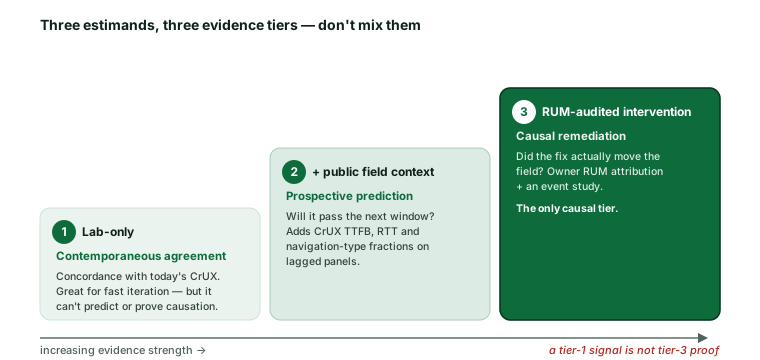
Most lab-vs-field arguments are confused because they mix three different questions, each needing a different evidence tier. Keeping them apart is half the discipline:
Contemporaneous agreement
Does today's lab result match the same CrUX window? This is a concordance analysis, not a forecast — the field window has already closed over the period the lab run sits inside, so it can't cleanly “predict” anything. Mind which CrUX product you are matching: BigQuery is calendar-monthly (its
yyyymmis the collection month, published the second Tuesday of the following month), while the rolling 28-day window belongs to the CrUX API/History API and PSI. The two are not interchangeable, and the kit keepscrux_productplus the real collection dates on every row so they can't be silently mixed. Lab-only is the right evidence tier.Prospective prediction
Will this origin pass CrUX next window? This needs lagged panels and public field-context features (TTFB, RTT, navigation-type fractions) — tier two: lab plus public reconciliation.
Causal remediation
Did a specific fix cause the field metric to move? Only owner RUM attribution and an event study can answer this — tier three. A lab delta alone never establishes it.
The three-tier evidence model maps directly onto these: lab-only for rapid iteration and concordance, lab + public field context for calibrated prospective prediction, and RUM-audited intervention for causal claims. Treating a tier-one signal as tier-three evidence is exactly how teams ship a “fix” that the field never feels.
The study design (built to survive review)
The executable design predicts a calibrated probability that an origin passes CrUX CWV, plus metric-specific p75 estimates and divergence-class probabilities, from four nested models:
- Model A — Lighthouse score only (the naïve baseline everyone uses).
- Model B — lab metrics separately: lab LCP, TBT, CLS, FCP, Speed Index, bytes.
- Model C — adds public field context: CrUX TTFB, the high-RTT population share, navigation-type fractions, form factor, month, HTTP Archive technology/request features. (LCP resource type is not in CrUX BigQuery; it comes from the CrUX API as resource-type fractions, on a rolling window that only approximately overlaps a calendar month — the kit treats it as an optional joined feature, not a BigQuery column.)
- Model D — adds repeated lab runs and, where available, owner RUM attribution.
The headline isn't whether C beats B on accuracy — it's where and why calibration improves. Evaluation is therefore calibration-first: Brier score, expected calibration error, calibration slope/intercept and conformal-interval coverage alongside AUROC/AUPRC — because a model with great ranking but poor calibration misprices risk and still drives wrong decisions. And validation is blocked, never random: random row splits leak origin identity and temporal structure. The protocol uses origin-blocked, time-blocked and technology-segment holdouts, with the split pre-registered before outcomes are seen.
The reconciliation playbook
The point of all this is operational: no team should burn weeks optimising the wrong proxy when the disagreement already indicates the failure mechanism. Read your lab-field pattern off the taxonomy, and the first move is determined:
- Lab fast, field slow on LCP → an unresolved transportability divergence, not yet a diagnosis. If field TTFB/RTT is also poor, work the server, edge, geography and cache path first. Otherwise the cause can still be the image: check the field LCP resource-type fractions and LCP subparts (TTFB, load delay, load duration, render delay), the actual LCP element at real viewports, and device, page and content mix — a lab run that gets a text heading or a cached hero while users get an uncached personalised image is fast in the lab and slow in the field because of the image.
- Lab TBT clean, field INP poor → the cost is after load. Attribute INP in RUM to the real interactions (menu, search, filters), not the page-load trace.
- Lab TBT poor, field INP fine → resist the score-driven rewrite. Add an INP guardrail and spend the effort where users actually feel it.
- CLS only in one place → it's a state problem. Replay consent/viewport/ad states for lab-only; collect shift attribution for field-only.
- Cold lab disagrees with field → check
navigation_types; a high bfcache/reload share means your cold run isn't the experience most users get. - Homepage lab disagrees with the origin → you're measuring the wrong page. Weight by template traffic; never claim an origin result from one URL.
Limitations
CrUX is a population, not a census
CrUX reports eligible Chrome users meeting traffic thresholds — not all browsers, and not low-traffic origins. Conclusions generalise to the CrUX-eligible public web, the stated target population.
Origin aggregation hides pages
CrUX origin units blend many templates; a single lab URL is one page. The design reports page-level and origin-level estimands separately and refuses homepage-only origin claims.
Same-month is concordance, not forecast
A same-window lab-vs-CrUX comparison can't be a clean prediction — the field window already happened. Prospective claims require lagged panels, kept distinct here on purpose.
No fabricated coefficients
This release is the framework, taxonomy and protocol; it does not report a fitted million-origin model. The kit is built to produce one — and to be audited when it does.
Data, code & sources
Published under CC BY 4.0:
the divergence taxonomy and feature dictionary, the BigQuery panel templates, a deterministic divergence
classifier, the calibration-first modelling protocol and the pre-analysis plan. The modelling protocol
implements Models A–D, the p75 regressions with split-conformal intervals, the divergence multiclass and
all three holdout regimes, and writes a manifest with the panel digest; the classifier ships a declared
input contract and refuses a panel that does not meet it. What you supply is a BigQuery project: the
panel SQL is parameterised on PROJECT.DATASET, and the exact CrUX column set should be
confirmed with the introspection step first, because CrUX schemas change.
Browse the artefacts
Key sources
- Kenny, B. (2021). Lighthouse scores as predictors of page-level CrUX data, HTTP Archive — the 43%-of-90+-fail baseline.
- Walton, P. (2021). My challenge to the web performance community — lab tools have blind spots; don't treat them as field-equivalent.
- Google Search Central (2023). Introducing INP to Core Web Vitals & web.dev. Lab and field data differences — the FID→INP shift and why lab ≠ field.
- Chrome UX Report. Methodology, BigQuery & navigation types (Pollard & Henkel, 2024) — the field dataset, its windows and navigation fractions.
- Lin, H. & Liu, W. (2025). Symmetry-Aware Causal-Inference-Driven Web Performance Modeling: A Structure-Aware Framework for Predictive Analysis and Actionable Optimization, Symmetry 17(12), 2058; Vovk, Gammerman & Shafer (2005), Algorithmic Learning in a Random World — modelling and conformal-prediction basis.
Cite this study
PageSpeedAudit Research (2026). When does lab predict field? An INP-era
replication framework, divergence taxonomy, and calibrated reconciliation
protocol for Lighthouse and CrUX.
https://pagespeedaudit.com/research/when-does-lab-predict-field

@misc{pagespeedaudit2026labfield,
  title  = {When does lab predict field? An INP-era replication framework,
            divergence taxonomy, and calibrated reconciliation protocol},
  author = {{PageSpeedAudit Research}},
  year   = {2026},
  url    = {https://pagespeedaudit.com/research/when-does-lab-predict-field},
  note   = {Taxonomy + reproducibility kit, CC BY 4.0}
}
Stuck between a green score and a failing grade?
A PageSpeedAudit report reads your lab and your CrUX field data together, classifies the divergence, and tells you which mechanism is actually failing — so you fix the server path, the post-load interaction or the page mix, not whichever proxy the score happened to flag. See the sister studies “Do Lighthouse's promised savings materialize?” and “How many Lighthouse runs prove a change?”